A US stock market outlook is an expert forecast estimating future equity performance, corporate profit trends, and broader economic health. While Wall Street firms issue these projections to guide institutional capital, long-term investors often have more to gain from focusing on controllable factors like portfolio fees and holding duration than from trying to time market cycles.
A US stock market outlook is an analytical projection of future index levels, corporate earnings, and economic conditions across American equity markets. Financial institutions publish these reports each season to guide institutional capital allocation.
When managing your own portfolio, reading a new forecast often triggers an urge to alter holdings. Rather than trying to predict where benchmark indices will trade over the next few quarters, taking a long-term market perspective allows you to ignore short-term noise and focus on factors within your direct control: portfolio fees, investment behavior, and holding duration.
Quick Takeaways
01Consensus market forecasts reflect short-term sentiment rather than dependable price roadmaps.
02Trading around seasonal volatility or calendar-year targets harms compounding and raises costs.
03Controlling portfolio fees can preserve more capital over ten years than attempting to time economic cycles.
04A routine year-end fee audit keeps recurring expenses from quietly eroding net returns.
What Drives the US Stock Market Outlook?
Market forecasts are primarily shaped by interest rate expectations, corporate earnings, and equity valuations. Forecasters track Federal Reserve policy to evaluate whether borrowing costs will fall, hold steady, or climb. Central bank decisions influence business investment, consumer spending, and the discount rate applied to future earnings.
Corporate profits form the second pillar. Analysts track projected revenue across benchmarks like the S&P 500 to estimate earnings growth. Finally, valuation multiples tie these projections together. Strategists compare forward price-to-earnings (P/E) ratios against historical norms, tempering expectations when valuations sit near record highs.
The Problem with Short-Term Forecasts
Short-term market forecasts suffer from poor accuracy because macroeconomic variables change without warning. For example, forecasts published under the banner of a US stock market outlook 2026 attempt to pinpoint exact index levels twelve to eighteen months ahead. Yet strategist year-end targets can differ widely from actual index results, so any single forecast is better treated as one informed opinion than as a roadmap.
Predictive models struggle equally with seasonal narratives. Financial media frequently highlights the stock market outlook October November period, warning of volatility or seasonal pullbacks. Reacting to these patterns by shifting into cash introduces timing errors and transaction drag.
For an investor pursuing a disciplined buy-and-hold strategy, reacting to short-term projections is counterproductive. Dodging anticipated dips usually means missing the sharp rebounds that deliver most long-term equity returns.
Shifting Focus: The Total Cost of Investing
While you cannot control market direction, you have complete control over the total cost of investing. The total cost of an investment portfolio includes fund expense ratios (the annual fee a fund deducts from its assets, expressed as a percentage), transaction commissions, bid-ask spreads (the gap between the price buyers will pay and the price sellers will accept), and any advisory fees charged to your account. Over long horizons, these visible and hidden expenses determine how much gross return remains in your portfolio.
Reducing structural holding costs can improve your net return, all else equal. Every dollar you do not pay in fees stays invested, where it can compound over time, although it remains exposed to the same market gains and losses as the rest of your portfolio.
The Impact of Annual Fee Drag
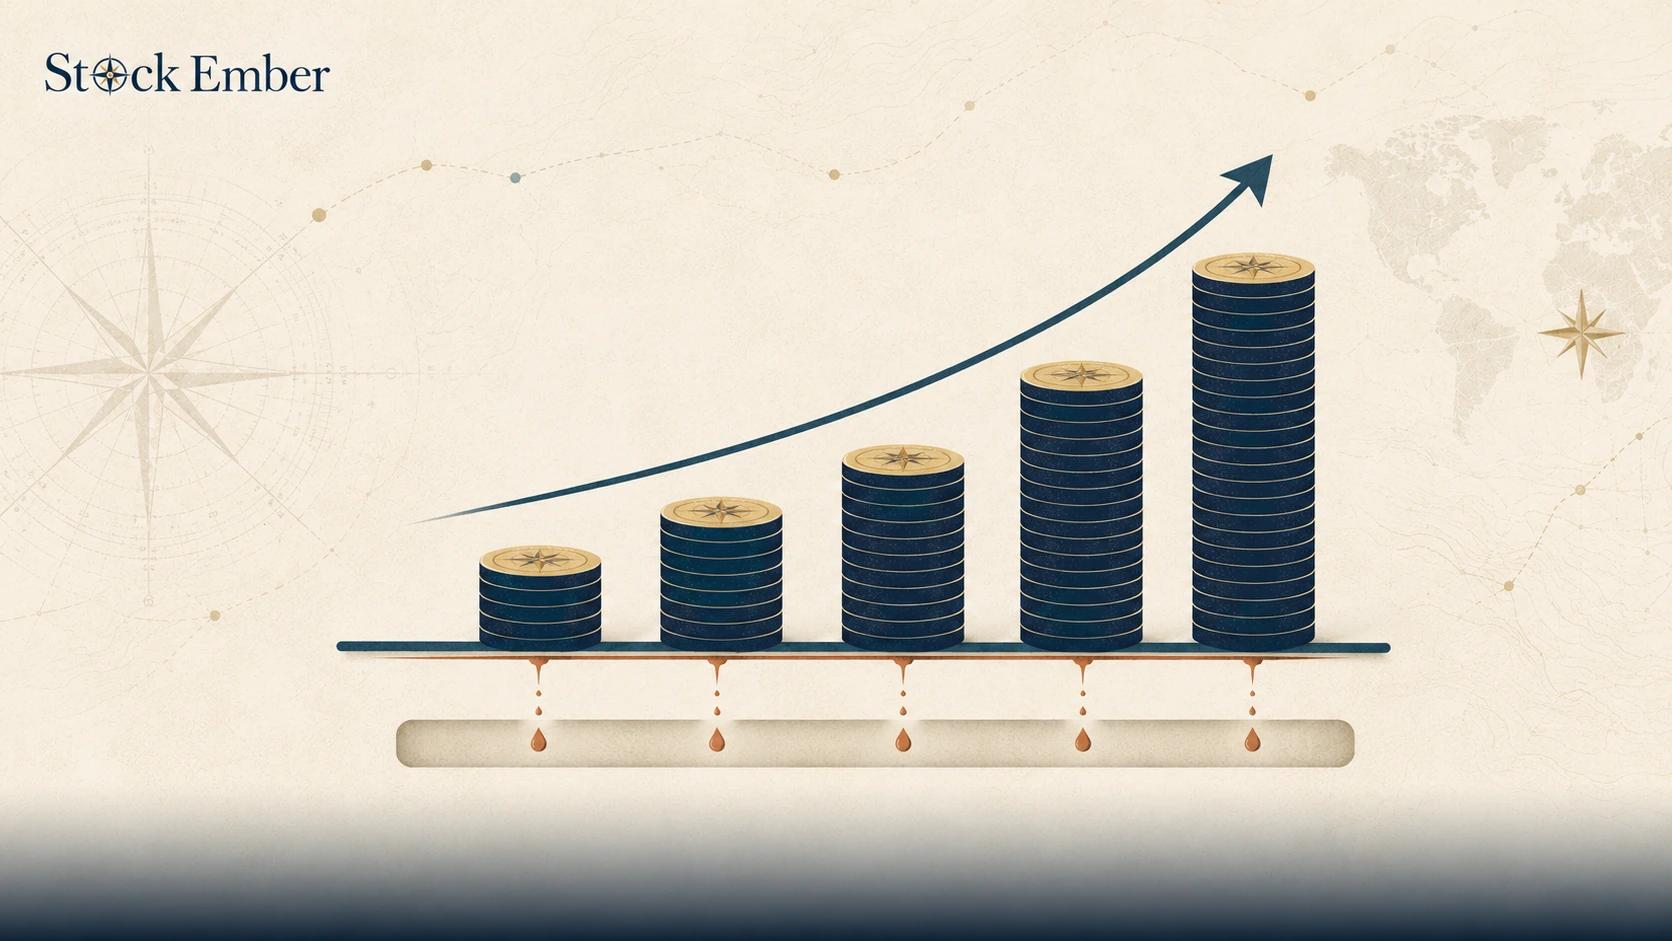
Annual fee drag represents the cumulative loss of portfolio value caused by recurring management expenses compounding over time. When a fund company deducts its fee, it permanently removes capital that would have otherwise generated future compound returns.
The foundation of low-cost investing starts with understanding a good expense ratio. Many broad-market index funds charge less than 0.10% per year, according to each fund's prospectus fee table. Research published by the US Securities and Exchange Commission illustrates that ongoing fees compound over time, reducing the balance that remains invested to generate future growth.
Consider an illustrative comparison of a $100,000 investment held for ten years with an assumed 7% average annual gross return. This is a hypothetical example, not a forecast: actual returns vary from year to year and can be negative, and fees reduce your results in every scenario.
Annual Fee
Ending Value (10 Years)
Estimated Fee Drag
0.05%
$195,798
$917
0.50%
$187,714
$9,001
1.00%
$179,085
$17,630
Over a decade, a 1.00% fee drains about $17,630 from your wealth compared with paying no fee, and about $16,700 more than the 0.05% fund. This silent drag occurs in bull and bear markets alike, showing why cost control outweighs forecast speculation.
How to Conduct a Year-End Investment Fee Audit
A year-end investment fee audit is a systematic review of all direct and indirect expenses charged across your accounts over the past year. Performing this audit replaces speculative moves with practical, wealth-preserving maintenance.
Follow three core steps to audit your portfolio costs:
Review Fund Expense Ratios: Check the prospectus for each fund you hold. Identify whether any legacy holdings carry expense ratios above 0.20%, and compare them against lower-cost index alternatives. Before selling anything, check the costs of switching: selling in a taxable account can trigger capital gains taxes, and some funds charge sales loads or redemption fees, so weigh those against the annual savings.
Catalog Account and Advisory Fees: Review annual brokerage statements for administration fees or advisory charges. If you pay an advisor 1.00% annually on top of fund costs, evaluate whether the advice justifies that recurring hurdle.
Inspect Cash Drag and Trading Friction: Measure cash sitting uninvested and tally trading commissions from frequent rebalancing. Keeping turnover low, meaning how often you buy and sell holdings, limits transaction drag and preserves capital.
Common Mistakes When Reading Market Outlooks
Investors frequently make predictable behavioral errors when consuming market forecasts:
Anchoring to Price Targets: Treating an analyst's target as a certainty creates false confidence. When economic conditions diverge from predictions, anchored investors often abandon their asset allocation plan.
Pausing Contributions During Volatility: Headlines forecasting weakness tempt investors to pause regular automatic contributions. Waiting for a market bottom usually leads to buying back in at higher prices after the recovery.
Ignoring Structural Costs: Focusing entirely on gross market returns while ignoring fee drag allows high expenses to quietly consume your gains. A portfolio paying high management fees requires superior returns just to match a basic index fund.
Conclusion
A sensible US stock market outlook does not depend on predicting macroeconomic shifts or guessing where equity indices will finish the year. Over a ten-year horizon, successful investing relies on steady participation, emotional discipline, and strict cost control. By conducting regular fee audits and keeping your structural expenses low, you can keep more of your investment returns working for you.
When evaluating your own portfolio costs, using a Fee Comparison Calculator can show exactly how much recurring charges take from your future wealth.
Investing in equities involves the risk of loss, including the possible loss of principal, and economic forecasts are opinions that cannot guarantee future market results.
FAQ
5 questions
How accurate are Wall Street year-end price targets historically?
Wall Street consensus price targets can miss actual index outcomes by a wide margin. Strategists and economists routinely fail to anticipate macroeconomic shocks, unexpected policy shifts, and sudden market drawdowns. Because forecasters tend to cluster around recent performance, relying on these projections for portfolio adjustments introduces serious timing risk.
Why do US stocks experience seasonal volatility in October and November?
Seasonal volatility late in the year often stems from mutual fund tax-loss harvesting, corporate earnings reports, and portfolio rebalancing before year-end reporting. In addition, US election cycles frequently create policy uncertainty during autumn. However, historically, trying to trade around these seasonal swings generates unnecessary transaction friction and often causes investors to miss subsequent year-end rallies.
Should I move my portfolio to cash when a market outlook predicts a recession?
Shifting to cash based on recession predictions is rarely effective for buy-and-hold investors. Market timing requires making two correct decisions: when to exit and when to re-enter. Stock markets regularly begin rebounding well before economic recessions officially end, meaning investors who wait for positive headlines typically buy back in at higher prices after the recovery is already underway.
How often should I review my investment fees?
Conducting an annual fee audit is generally enough for most index investors. A regular year-end review allows you to verify that your funds still maintain competitive expense ratios, assess whether advisory fees remain justified, and eliminate idle cash drag without inducing unnecessary trading activity or emotional churn throughout the year.
What is an acceptable total expense ratio for a US stock index fund?
For broad US market index funds and exchange-traded funds, an expense ratio below 0.10% annually is considered excellent. Many leading total market and S&P 500 index funds charge very low expense ratios, which you can confirm in each fund's prospectus fee table. Paying significantly more than 0.20% for basic index exposure creates unnecessary fee drag that silently erodes your long-term compounding returns.
Disclaimer
This guide was written with AI assistance and reviewed by the StockEmber editorial team for accuracy. StockEmber provides independent education, not personal financial advice. Investing puts your capital at risk: the value of investments can go down as well as up, you may get back less than you invest, and past performance doesn’t guarantee future results. Some links may support our work at no additional cost to you.
The StockEmber Team is our in-house desk of independent research writers. We test brokerage platforms, read the fine print on fees and custody, and cover ETFs and long-horizon investing for people who plan to hold for decades — not days.