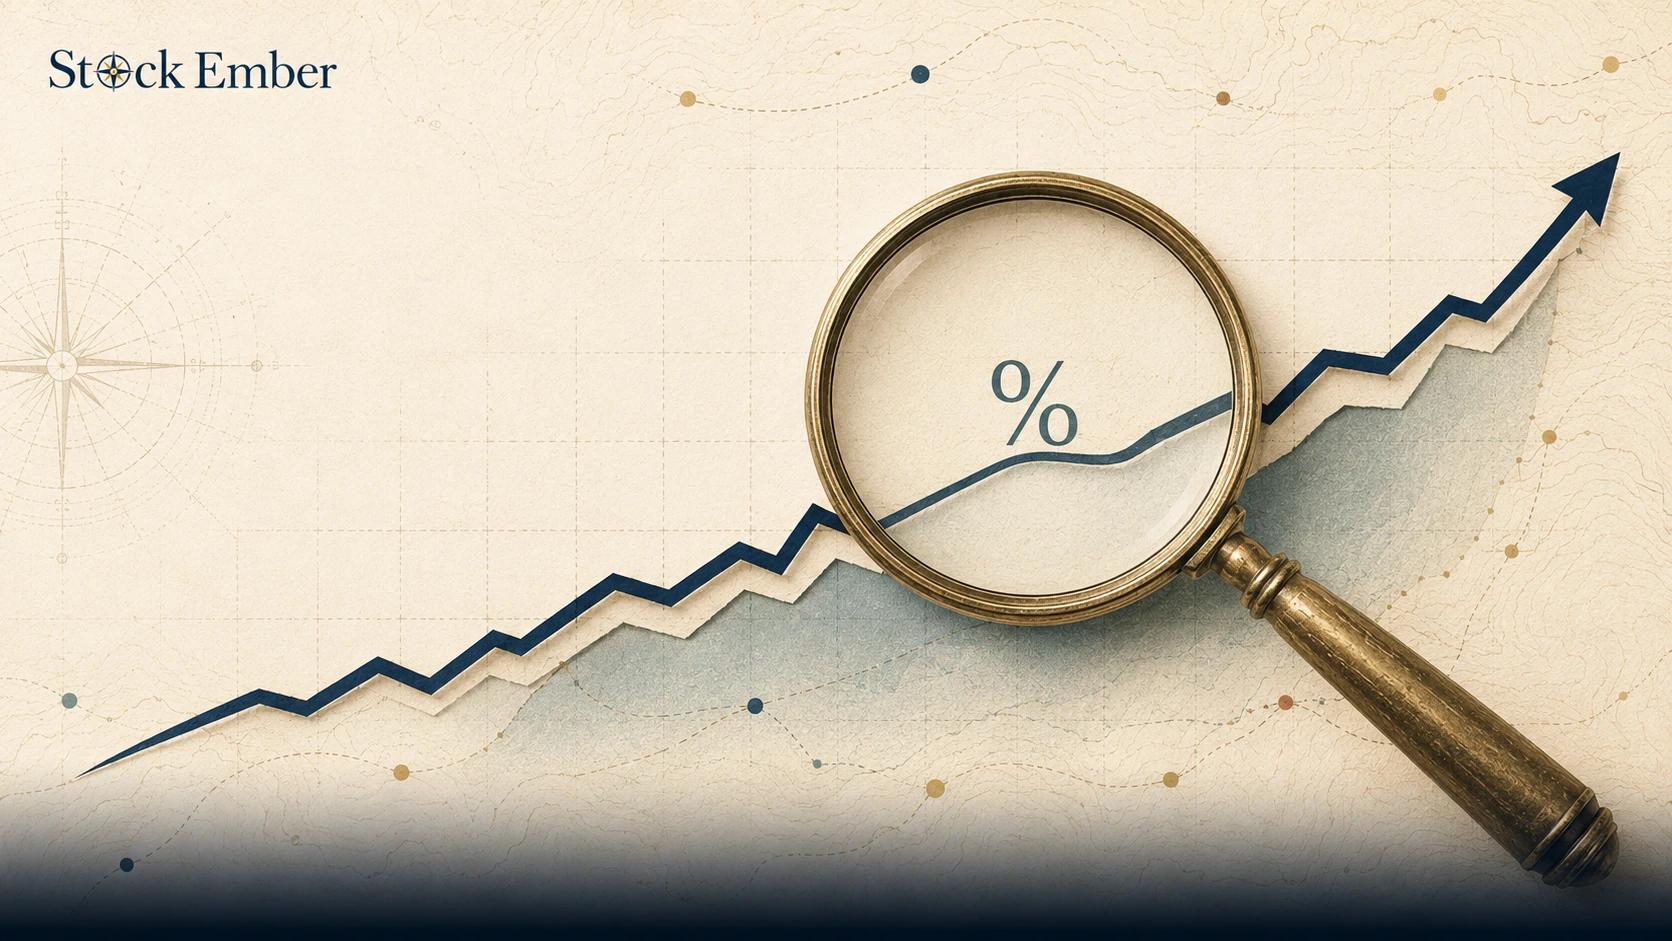
An expense ratio is the annual percentage fee mutual funds and exchange-traded funds (ETFs) charge to cover operational, administrative, and management costs. It is deducted directly from fund assets rather than billed as an out-of-pocket invoice.
When evaluating a fund, a 0.50% or 1.00% annual fee might look like a harmless rounding error. However, ongoing fund costs do not just reduce cash balances today—they compound against future asset growth over time. Understanding how expense ratios work, how they are charged, and how gross and net fees differ is essential for protecting your portfolio returns over a multi-year horizon.
What Is an Expense Ratio?
An expense ratio is the total annual cost of managing and operating an investment fund, expressed as a percentage of the fund's average net assets. When you pool your money into a fund with thousands of other investors, the fund manager incurs ongoing costs to run the portfolio. The expense ratio represents your proportional share of those operational expenses.
An expense ratio is made up of several distinct underlying operational costs:
- Management fees: Payments made to the fund sponsor and portfolio managers who select assets, rebalance holdings, and execute strategy.
- Administrative and operational costs: Overhead for record-keeping, legal compliance, auditing, custodian services, and shareholder accounting.
- Marketing and distribution fees: Also known as 12b-1 fees in certain mutual funds, these cover broker compensation and promotional expenses.
It is equally important to know what an expense ratio does not cover. It does not include direct brokerage trading commissions, bid-ask spreads, or individual sales loads charged by brokers when buying or selling shares.
Understanding these baseline mechanics is essential when analyzing overall the cost of investing (investment fees)
How Expense Ratios Work (And How They Are Charged)
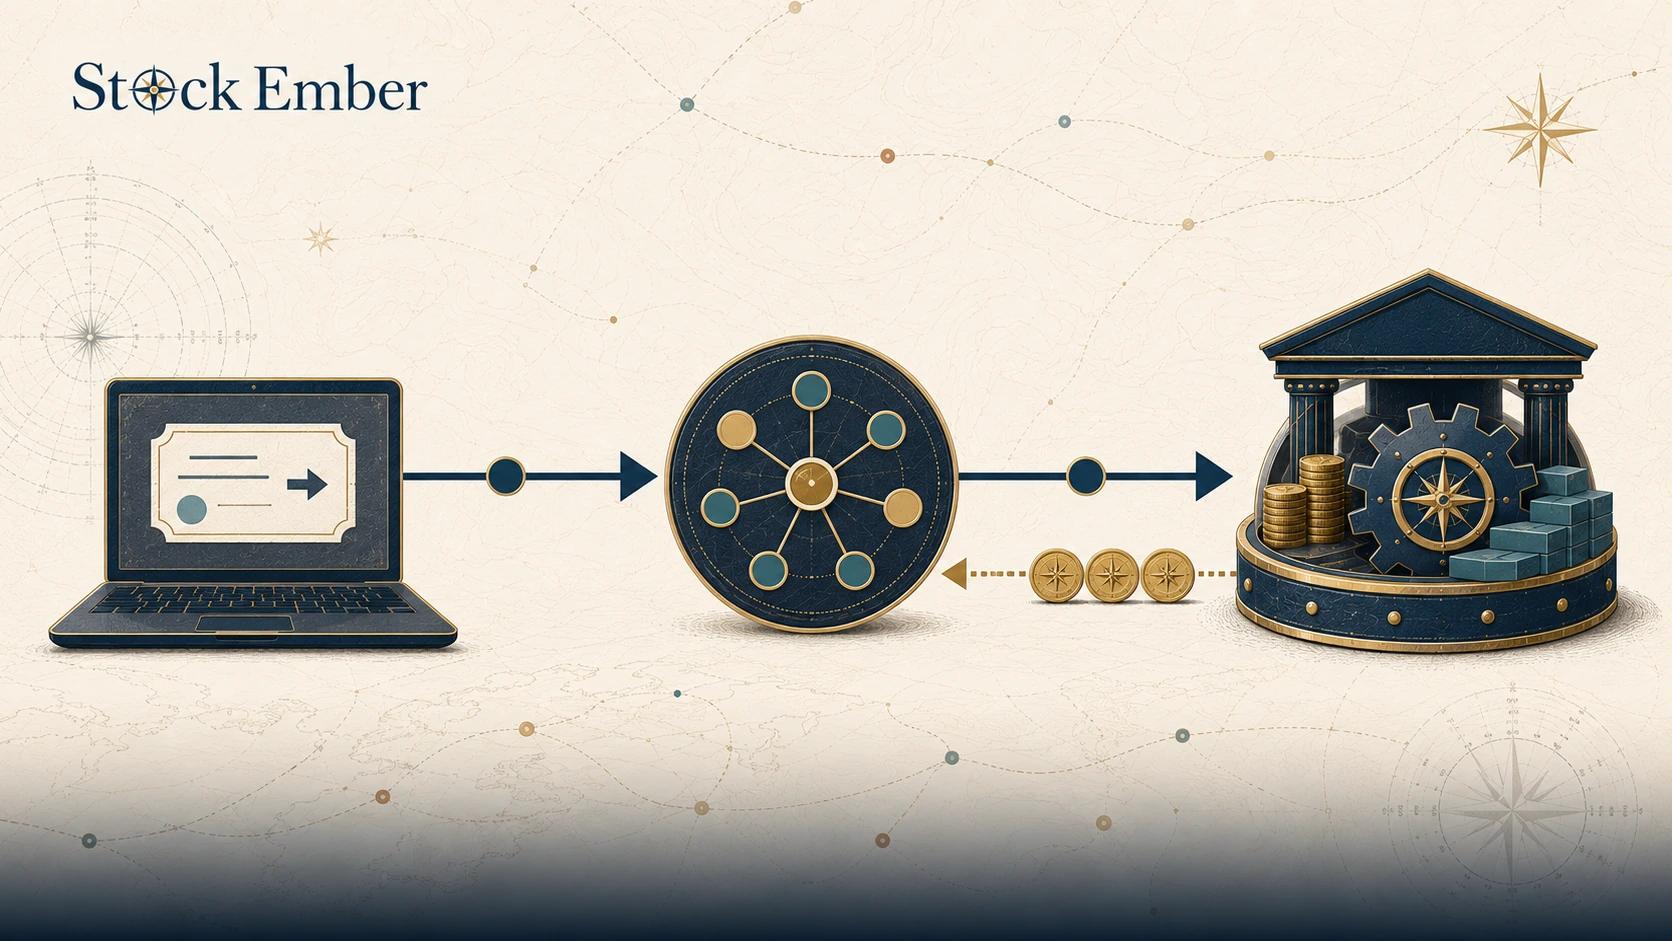
Expense ratios are charged by deducting costs automatically from a fund's Net Asset Value (NAV) on a daily basis, rather than issuing a monthly invoice or deducting cash directly from your brokerage cash balance.
Because fees are incorporated directly into the fund's asset value, you will never see an explicit fee line item on your account statement. If a fund holds an annual expense ratio of 0.50%, the fund provider divides that annual percentage across 365 days (roughly 0.00137% per day) and deducts that micro-fraction from the fund's NAV before the daily closing price is published.
To understand the single-year dollar cost on a $10,000 portfolio:
- 0.05% expense ratio: Costs $5 per year.
- 0.20% expense ratio: Costs $20 per year.
- 0.75% expense ratio: Costs $75 per year.
- 1.25% expense ratio: Costs $125 per year.
Because fund returns reported in financial media are calculated from daily NAV changes, all published performance returns are already net of the expense ratio. However, looking at single-year costs in isolation hides the true long-term impact on your wealth.
The 10-Year Cost: How Expense Ratios Drag Down Compound Growth
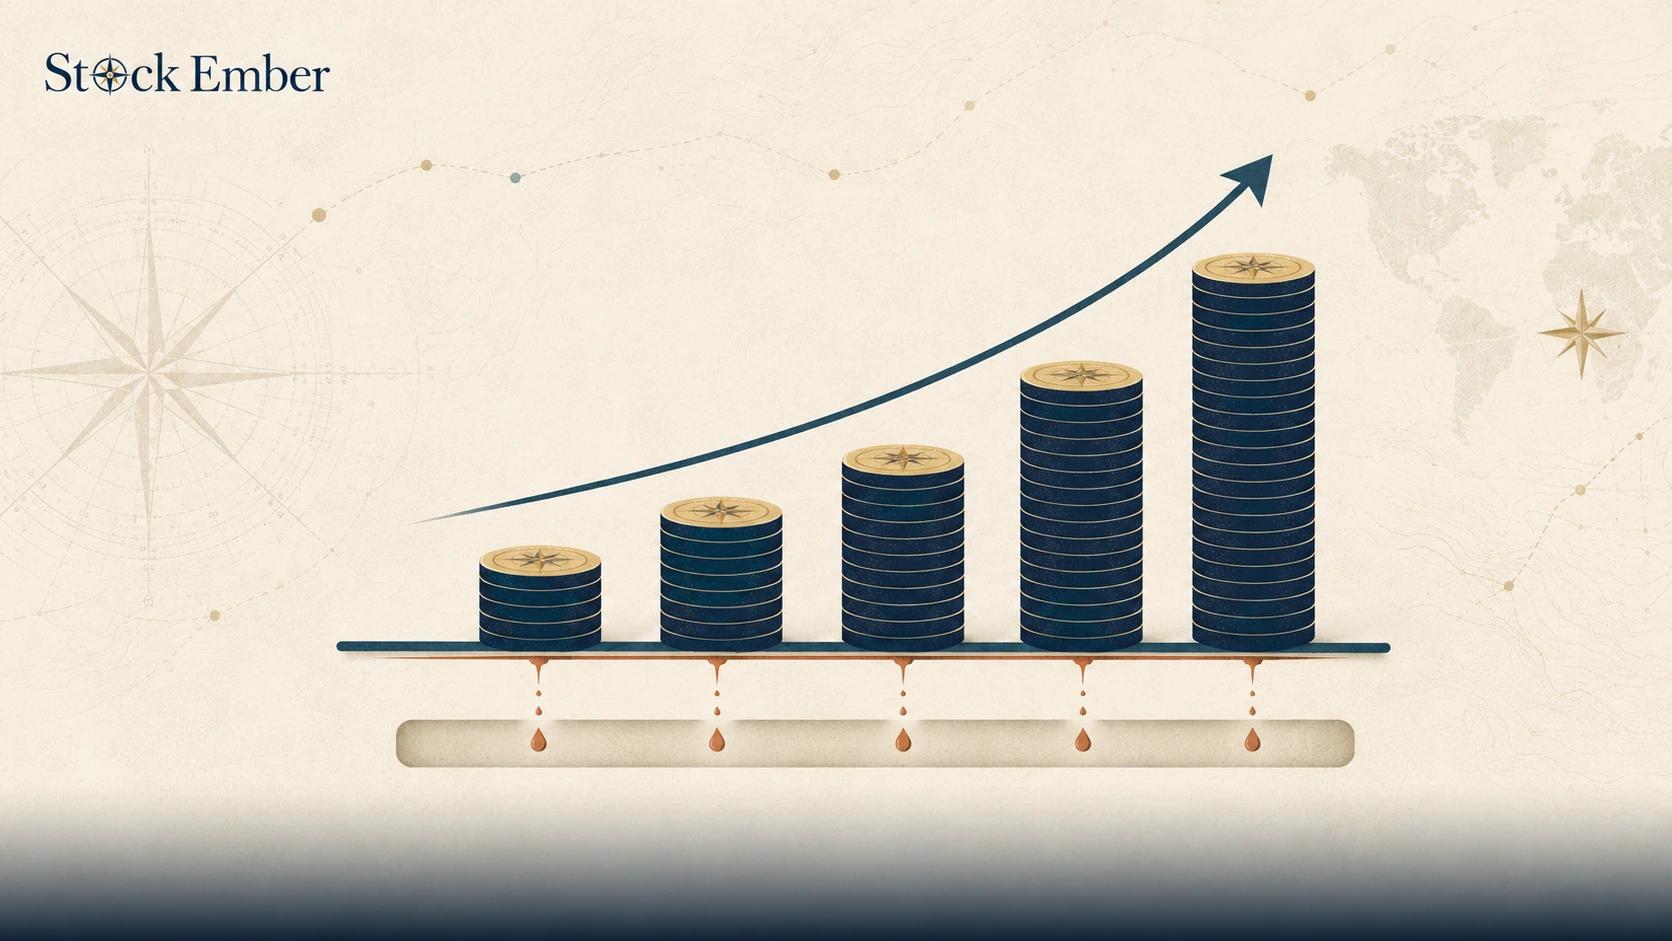
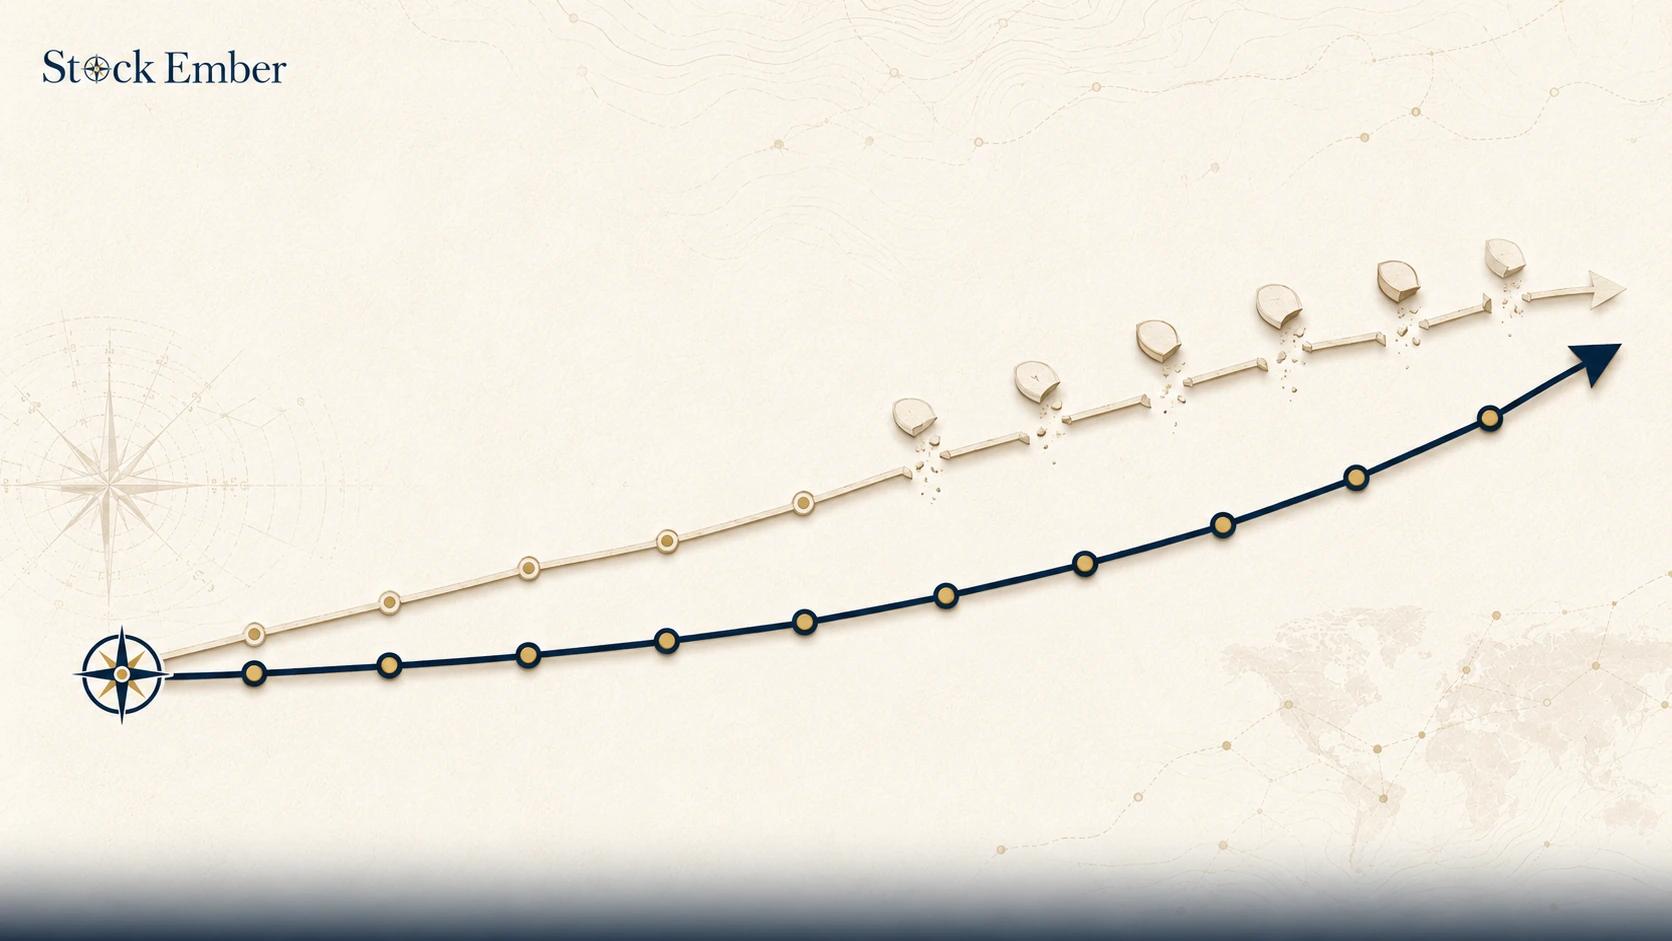
The true financial burden of an expense ratio is not its single-year dollar cost, but the cumulative compound growth that money fails to generate over a decade or longer. When a fee is deducted from your fund assets, you do not just lose that cash today—you lose every dollar of compound interest that cash would have earned for the next 10, 20, or 30 years.
Consider a hypothetical initial investment of $100,000 held for 10 years, assuming a gross portfolio return of 7.00% annualized before fees:
- Low-Cost Passive Fund (0.05% expense ratio): Net annual return is 6.95%. After 10 years, your $100,000 grows to approximately $195,800. Total fees paid over the decade equal roughly $800.
- Higher-Cost Active Fund (0.85% expense ratio): Net annual return is 6.15%. After 10 years, your $100,000 grows to approximately $181,600. Total direct fees paid equal roughly $12,100.
The difference in total wealth after 10 years is $14,200.
Notice that the actual wealth gap ($14,200) is larger than the simple sum of explicit fee payments ($12,100). That extra $2,100 difference is the "phantom cost"—the compound returns that your deducted fee dollars were unable to build.
Gross Expense Ratio vs. Net Expense Ratio (And Fee Waivers)
A gross expense ratio reflects the total actual operating expenses incurred by a fund, whereas a net expense ratio represents the fee investors currently pay after accounting for temporary fee waivers or expense reimbursements.
Fund managers frequently use fee waivers when launching a new ETF or mutual fund. To attract initial capital, the manager might agree to cap expenses or waive part of their management fee for a specified period.
- Gross Expense Ratio: What it actually costs to operate the fund (e.g., 0.45%).
- Net Expense Ratio: What you pay today after contractual fee waivers (e.g., 0.15%).
While a low net expense ratio is beneficial, long-term buy-and-hold investors must read the fund prospectus to check the waiver expiration date. If a fund's net ratio of 0.15% is backed by a waiver expiring in 12 months, your ongoing costs could jump to the gross ratio of 0.45% overnight.
Expense Ratio vs. Total Cost of Ownership (TER)
While a standard expense ratio covers primary fund operating costs, a total expense ratio (TER) provides a broader measure of total annual fund expenses, though neither metric includes external trading friction.
In many European and international fund structures, regulators require funds to publish a TER or Ongoing Charges Figure (OCF). These figures include minor operational items that standard US expense ratios sometimes omit, providing a more comprehensive reflection of ongoing internal fund costs.
However, neither a standard expense ratio nor a TER captures the full Total Cost of Ownership (TCO) of holding a fund. Expenses sitting outside the listed expense ratio include:
- Portfolio turnover trading costs: Commissions paid by the fund manager inside the fund when buying and selling underlying portfolio holdings.
- Bid-ask spread: The difference between the highest price a buyer is willing to pay and the lowest price a seller is willing to accept when you purchase ETF shares on an exchange.
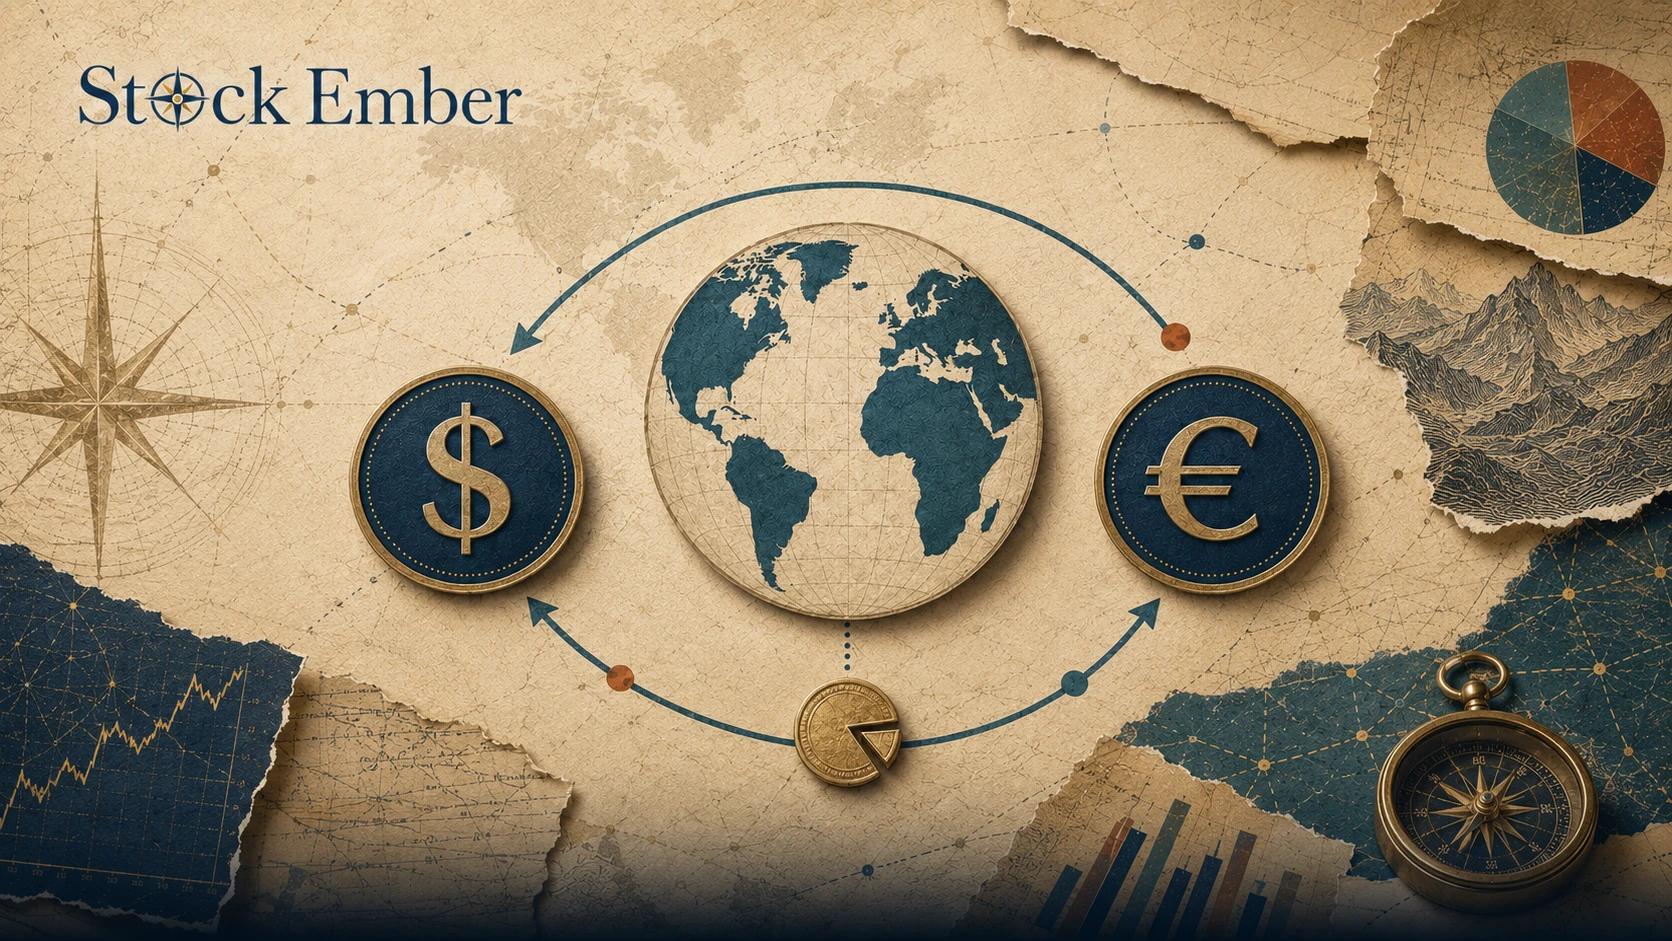
- Brokerage FX fees: Currency conversion costs incurred if you purchase a foreign-denominated fund through your brokerage account.
Active vs. Passive Funds: What Is a Good Expense Ratio?
A good expense ratio depends on the asset class and management strategy, but for broad-market passive index funds, competitive annual fees typically range between 0.03% and 0.20%.
When learning what an ETF is, investors quickly notice a structural cost divide between passive index funds and actively managed funds:
- Passive Index ETFs: These funds simply track a broad market benchmark (such as the S&P 500 or Total Stock Market index) using automated rules. Because they require no active research teams or security selection, operating costs are low (0.03% to 0.15%).
- Actively Managed Funds: These funds employ analysts and portfolio managers seeking to beat the market. Due to higher research overhead and trading volume, active expense ratios typically range from 0.50% to 1.50%+
Because an active fund manager starts every year behind by an extra 0.50% to 1.00% in ongoing fees, beating broad index benchmarks over a 10-year period becomes a steep mathematical hurdle.
3 Expense Ratio Mistakes Long-Term Investors Make
- Evaluating fees on a single-year timeline: Looking at a $50 annual difference on paper leads investors to believe fund fees do not matter, completely missing the multi-thousand-dollar compounding penalty over 10 years.
- Confusing net and gross expense ratios: Buying a fund based on a low net expense ratio without verifying whether that rate is protected by a temporary waiver that could expire shortly.
- Assuming zero-expense-ratio funds have zero holding cost: Overlooking underlying bid-ask spreads, tracking difference, and internal transaction friction when trading ultra-low-cost or zero-fee products.
Conclusion
An expense ratio is not just a line item on a fund factsheet—it is an ongoing cost that directly determines how much of your gross investment returns remain in your pocket. Over a 10-year holding period, keeping ongoing fund fees low is one of the few variables fully within an investor's control to maximize long-term wealth accumulation. When evaluating how ongoing costs affect your personal portfolio over time, testing your numbers with dedicated investment tools and calculators is a practical next step.