A good price-to-earnings (P/E) ratio depends on sector benchmarks, expected earnings growth, and broader economic interest rates rather than a single fixed number. While historical broad-market averages like the S&P 500 typically range between 15 and 25, growth-oriented sectors often command higher multiples while mature industries trade at lower ratios.
The price-to-earnings (P/E) ratio measures a company's stock price against its annual earnings per share. Historically, broad market averages like the S&P 500 have fluctuated between 15 and 25, but there is no universal number that defines a "good" ratio.
Investors often look for a single cutoff number when evaluating stocks, expecting a quick signal to buy or pass. However, judging a valuation through one metric alone can be misleading. A ratio that looks cheap in one industry might signal trouble in another.
This guide explains how the P/E ratio works, why target numbers vary across sectors, and how long-term investors evaluate valuations without falling into common traps.
Quick Takeaways
01There is no single "good" P/E ratio that applies to every stock or market environment.
02Historical broad-market P/E ratios typically average between 15 and 25, though sector norms differ widely.
03Low P/E ratios can signal a solid bargain or a value trap where profits are falling.
04High P/E ratios reflect strong market expectations for future earnings growth rather than simple overvaluation.
05Long-term index investors do not need to evaluate single-stock P/E multiples to build wealth.
What Is the P/E Ratio and How Is It Calculated?
The P/E ratio tells you how much investors pay for every $1 of profits a business generates. It translates a company's share price into a relative value figure based on its corporate profits.
The basic formula is straightforward:
P/E Ratio = Share Price / Earnings Per Share (EPS)
In this equation, the share price represents the current market price of one stock share. Earnings per share (EPS) is the company's total net income divided by its total outstanding shares. For example, if a business trades at $50 per share and earns $2.50 per share over a year, its P/E ratio is 20 ($50 divided by $2.50).
Investors encounter two primary variations of this calculation:
Trailing P/E (TTM): Uses actual reported profits over the past 12 months. It relies on confirmed financial reports, though past profits do not guarantee future earnings.
Forward P/E: Uses analyst estimates for expected earnings over the next 12 months. It accounts for anticipated earnings growth, but analyst projections can prove inaccurate if business conditions change.
When a firm reports negative earnings or operates at a loss, calculating a P/E ratio yields a negative number. In standard practice, financial reports list the P/E as "N/A" or "Not Meaningful" because negative multiples offer little standard comparison value.
What Is Considered a "Good" P/E Ratio?
A "good" P/E ratio depends entirely on context. Asking what is a good P/E ratio for stocks is similar to asking what is a reasonable price for a house, it depends on location, condition, and growth potential.
Historically, the broader US market as measured by the S&P 500 has maintained a mean P/E ratio of around 15 to 16, typically fluctuating between 15 and 25. Based on this benchmark, many traditional value investors historically viewed a ratio below 15 as relatively cheap and a ratio above 25 as expensive.
However, using a fixed cutoff number to decide what is a good P/E ratio to buy a stock creates significant blind spots:
Ratios Below 15: May indicate an undervalued company with stable cash flows. Alternatively, it can indicate a struggling business with declining long-term profit prospects.
Ratios of 15 to 25: Typically align with historical broader market averages for mature, moderately growing businesses.
Ratios Above 25: Reflect high expectations for rapid profit growth. Investors pay more today because they expect earnings to expand rapidly in coming years.
Attempting to determine what is a good P/E ratio to buy requires comparing the ratio against industry peers and historical company trends rather than chasing a fixed cutoff point. If you are new to evaluating business metrics, establishing strong fundamentals through investing in stocks provides essential context before analyzing single-stock ratios.
Why "Good" P/E Ratios Vary by Sector and Interest Rates
An appropriate valuation changes significantly depending on a company's business model and broader economic conditions.
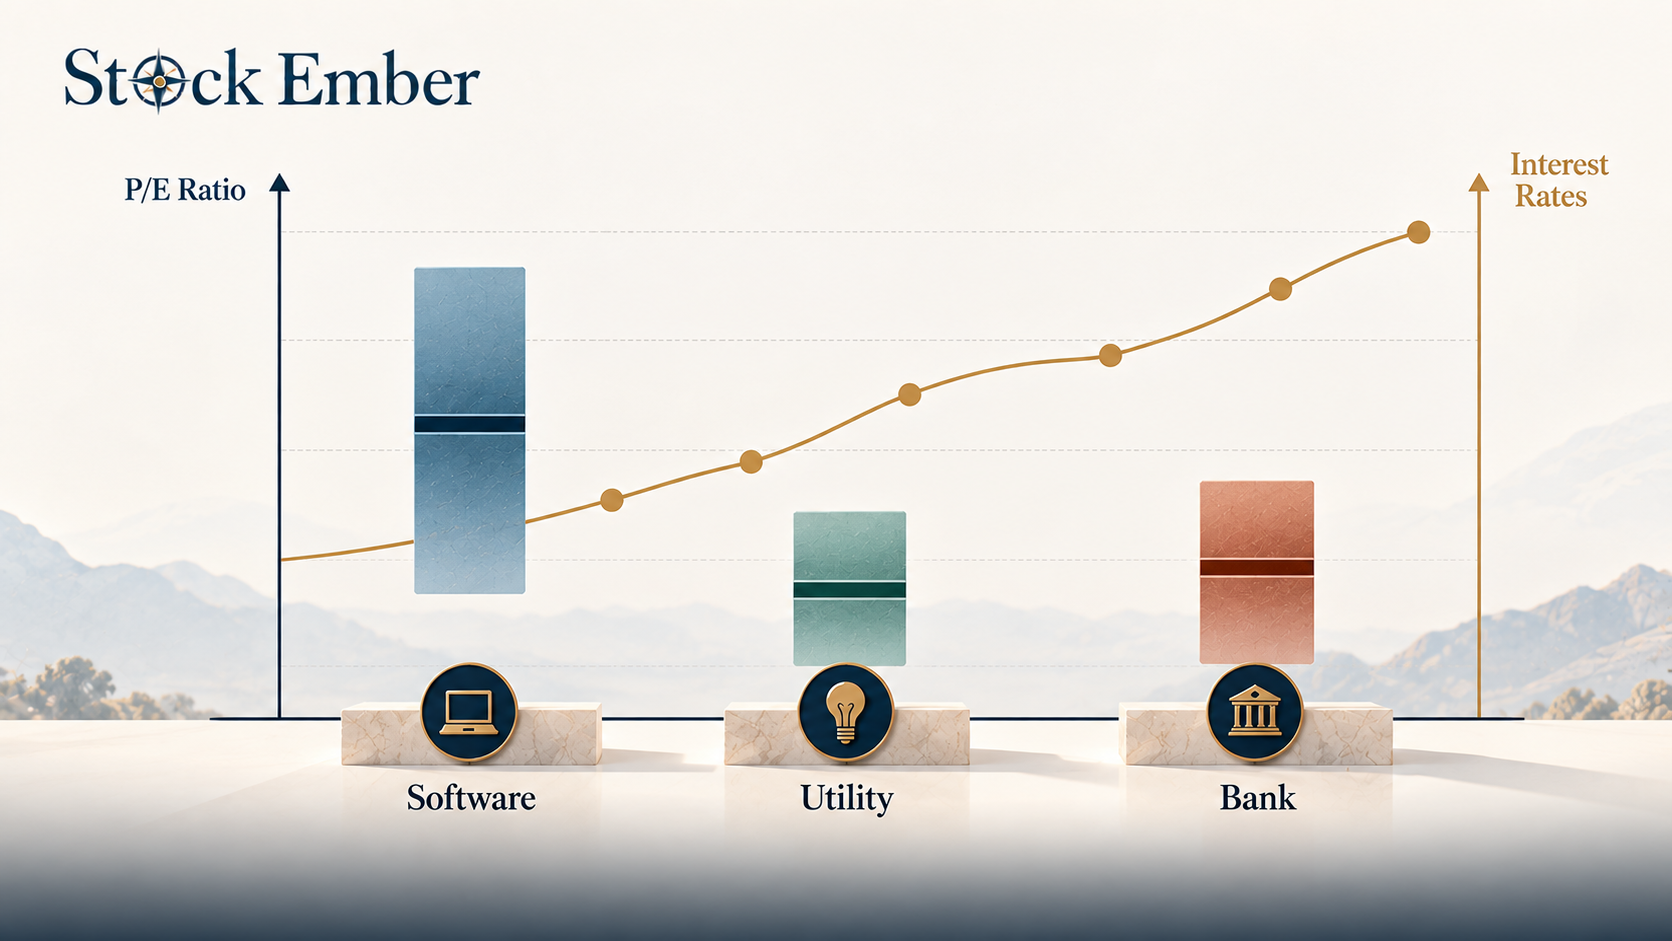
Chart comparing sector P/E ratios and interest rate influences.
Different industries operate under distinct growth rates and capital demands. Capital-intensive or mature sectors like utilities and financial institutions frequently trade at lower multiples, often between 10 and 18. Their future earnings growth is generally steady but capped. Conversely, technology and software firms often trade at multiples of 30, 40, or higher. Investors willingly pay a premium because scalable technology models can double or triple earnings over short periods.
Macroeconomic interest rates also reset baseline valuations across the entire stock market. When risk-free interest rates on cash and government bonds are low, investors accept higher stock valuations because alternative investments yield very little. When central bank interest rates rise, investors demand higher returns from equities. Higher interest rates increase the discount rate applied to future corporate earnings, which depresses market-wide P/E multiples.
Valuation Risks: Low P/E Traps vs. High P/E Premium
Relying solely on a low multiple to find bargain stocks introduces specific investment risks that can drag on long-term performance.
The Value Trap Risk
A low P/E ratio is not always a bargain. A stock trading at a multiple of 8 may appear cheap, but if company profits drop by 50% next year, the effective price paid relative to future earnings doubles. Cyclical businesses in energy or manufacturing often show very low P/E ratios at the top of an economic cycle when earnings peak. When economic conditions soften and earnings drop, the low multiple disappears.
Overpaying for Growth
Buying high-multiple growth stocks carries its own structural risk. If a stock trades at a P/E of 60 based on expectations of 30% annual growth, even a minor earnings disappointment can lead to a sharp price decline. The stock price contracts to match lower growth realities, extending the time required for an investor to break even.
The 10-Year Compounding Lens
In practice, many long-term investors find that overpaying relative to earnings creates a long recovery timeline. Consider a simple illustrative example: if you buy a business at an excessive multiple, it can take 10 years of earnings growth just for corporate profits to catch up with the initial price paid. Over a 10-year holding period, that valuation lag drags down overall portfolio returns compared to buying reasonable quality at fair valuations.
What Is a Good P/E Ratio for Buy-and-Hold Investors?
For long-horizon investors, the P/E ratio is best used as one context clue among many rather than a standalone decision metric.
When evaluating an individual company, pair the P/E ratio with other fundamental balance sheet indicators, such as the P/B ratio, to measure stock price against tangible net assets. Comparing price-to-earnings against debt levels, cash flow, and historical profit stability gives a clearer picture of financial health.
For investors who build wealth primarily through broad-market index funds or ETFs, individual P/E metrics matter far less. Index funds hold hundreds or thousands of companies across various sectors, automatically blending low-multiple value stocks with high-multiple growth stocks.
Over multi-decade horizons, broad index compounding depends on overall economic production and dividend reinvestment rather than individual stock selection.
Conclusion
Evaluating whether a P/E ratio is reasonable requires looking beyond a single metric. A ratio between 15 and 25 offers a broad historical baseline, but acceptable valuations depend on sector norms, expected earnings expansion, and prevailing interest rates. Rather than searching for a universal buying threshold, compare ratios against industry peers, balance sheet strength, and long-term earnings durability.
When you are ready to evaluate platforms for building a diversified portfolio, our Broker reviews provide a clear starting point for comparing account features.
Investing always involves risk of capital loss, and past market performance does not guarantee future results. Treat metric analysis as educational groundwork for your broader investment research.
FAQ
5 questions
What is a good P/E ratio to buy a stock?
There is no universal P/E cutoff number that signals an automatic buy. A "good" ratio depends on whether a stock is priced fairly relative to its industry peers, historical earnings stability, and projected future growth. Comparing a single company's ratio against sector averages and balance sheet durability provides a clearer picture than chasing a fixed benchmark.
Is a lower or higher P/E ratio better for investors?
Neither is inherently superior on its own. A lower P/E ratio indicates that you pay less per dollar of current profit, which can signal an undervalued bargain or a business in decline. A higher P/E ratio means investors expect rapid earnings growth in the future, though it leaves less room for error if company earnings underperform expectations.
What is a good P/E ratio for growth stocks?
Growth stocks frequently trade at elevated P/E ratios of 30, 40, or higher because investors expect profits to expand rapidly over time. Evaluating a growth stock involves assessing whether future profit expansion can justify the higher valuation multiple paid today.
Is a P/E ratio of 20 considered good?
A P/E ratio of 20 sits comfortably within the broad market's historical average range of 15 to 25. For a mature business with steady, modest growth, a ratio of 20 is often considered a fair valuation, whereas for a fast-growing tech company it might represent an attractive price.
What happens if a company has a negative P/E ratio?
A company receives a negative P/E ratio when it operates at a net loss over the measurement period. In practice, financial platforms list the P/E ratio as "N/A" or "Not Meaningful" because negative multiples do not offer a useful standard for valuation comparisons across companies.
Disclaimer
This guide was written with AI assistance and reviewed by the StockEmber editorial team for accuracy. StockEmber provides independent education, not personal financial advice. Investing puts your capital at risk: the value of investments can go down as well as up, you may get back less than you invest, and past performance doesn’t guarantee future results. Some links may support our work at no additional cost to you.
The StockEmber Team is our in-house desk of independent research writers. We test brokerage platforms, read the fine print on fees and custody, and cover ETFs and long-horizon investing for people who plan to hold for decades — not days.