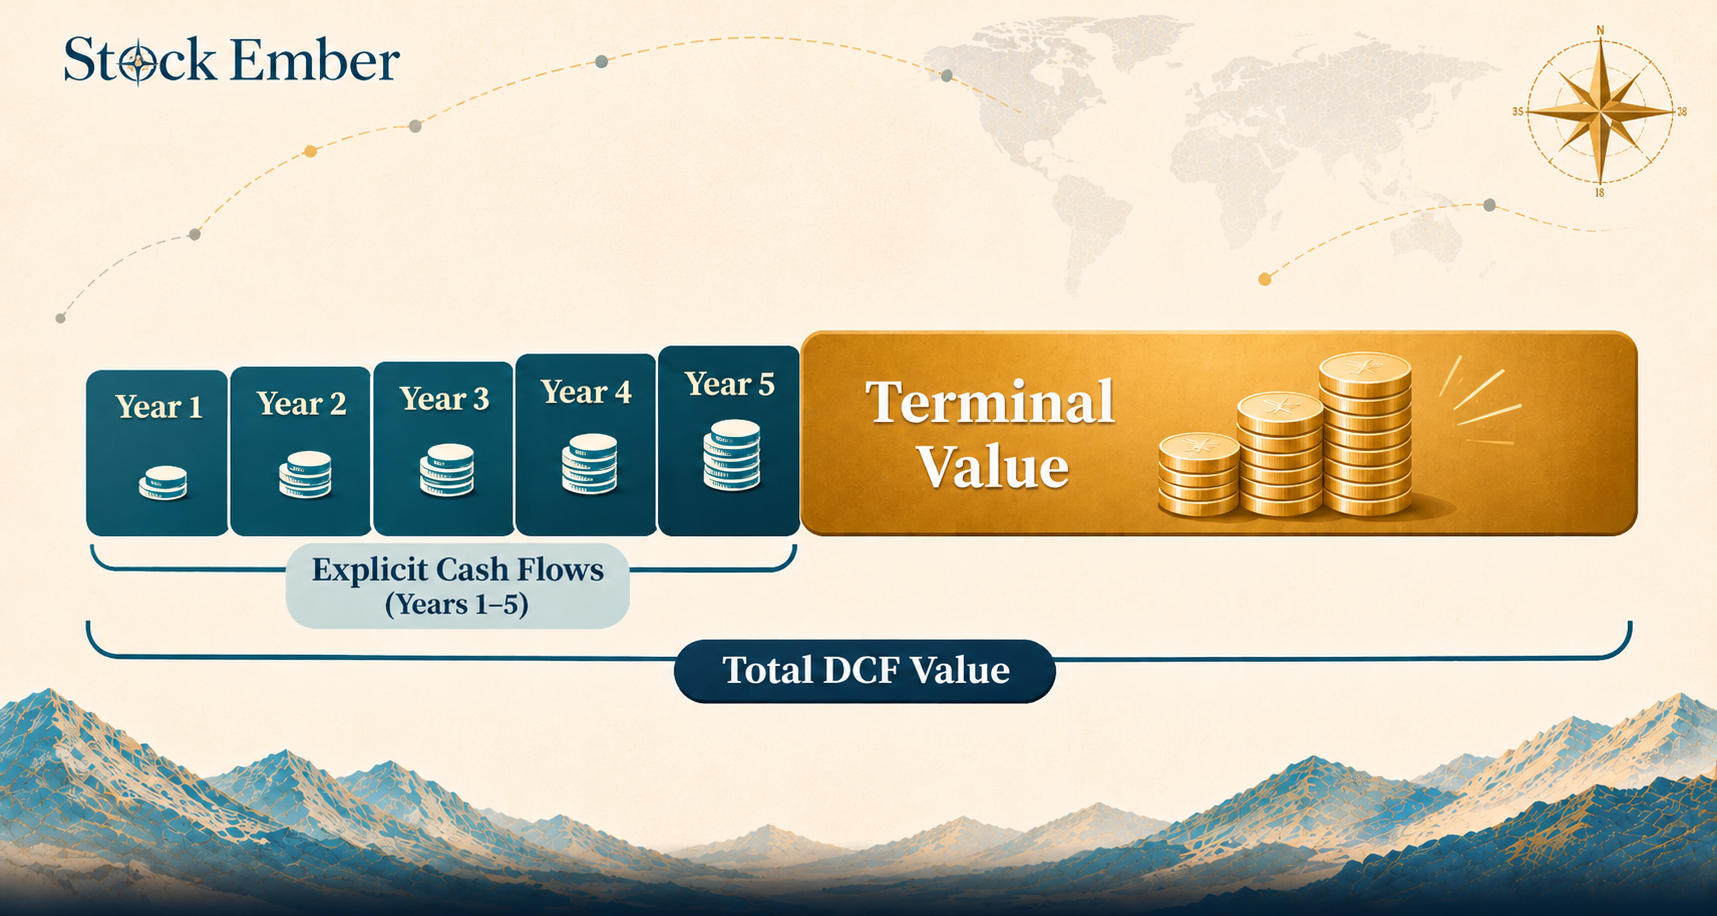
In stock valuation, terminal value represents the projected worth of a company's cash flows for all years after an analyst's initial 5- to 10-year forecast ends. Analysts calculate it using a perpetual growth formula or an exit multiple, and it frequently accounts for the largest portion of a discounted cash flow estimate.
Terminal value is the estimated worth of all future cash flows a business will generate beyond a multi-year financial forecast window, usually 5 to 10 years.
When analysts value a company, they can project next year's sales with reasonable care, but nobody can build a line-by-line budget 30 years out. Because that distant future often makes up most of a stock's estimated value, small changes in long-term assumptions can swing a valuation dramatically. Here is how this estimate works, how analysts calculate it, and why everyday investors should treat the output with caution.
Quick Takeaways
01This end-of-forecast estimate captures everything a business is expected to earn after an analyst's explicit 5- to 10-year forecast ends.
02Analysts calculate it using either a perpetual growth formula or an exit multiple based on comparable market prices.
03Growth stocks rely much more heavily on this figure than mature value stocks, making their share prices more sensitive to interest-rate shifts.
04Tiny tweaks to growth or discount-rate assumptions can change the long-term value by billions of dollars, so the number is never a reliable standalone price target.
What Is Terminal Value?
Terminal value is a lump-sum estimate of what a business will be worth at the end of a short-term forecast period. When you are investing in stocks, you are buying a slice of an ongoing business that does not simply close its doors after 5 or 10 years.
To estimate what that business is worth today, analysts often build a discounted cash flow (DCF) model, a method that projects a company's yearly cash profits and translates them back into today's dollars. Because projecting every single year forever is impossible, analysts forecast the next 5 to 10 years in detail and group every year after that into one final figure: terminal value.
Think of valuing a profitable neighborhood bakery. You can reasonably estimate how many loaves of bread it will sell over the next 5 years based on current foot traffic and oven capacity. By year 6, however, you stop guessing daily bread counts and instead estimate what the bakery as a whole would sell for as an established, ongoing business.
Beginners sometimes confuse 2 different uses of the phrase. In corporate finance and stock analysis, the standard terminal value meaning is this open-ended business value beyond a DCF forecast window. In personal savings or bond math, the same phrase simply describes the ending balance of an account or fixed-term investment on its maturity date.
How Analysts Calculate Terminal Value
With terminal value explained in plain terms, the next step is the math: analysts rely on 2 standard formulas to put a number on those distant years. Both start with the company's free cash flow, the cash left over after paying operating bills and maintaining equipment, in the final year of the explicit forecast.
The first approach is the Perpetual Growth Method (also called the Gordon Growth Model), which assumes the business keeps growing at a steady, modest pace forever:
Terminal Value = Final Year Cash Flow * (1 + Perpetual Growth Rate) / (Discount Rate − Perpetual Growth Rate)
Here, the perpetual growth rate is the steady yearly rate at which cash flows are assumed to grow indefinitely, while the discount rate is the annual return rate used to convert future dollars into today's dollars. Because no single company can outgrow the broader economy forever without eventually becoming larger than the economy itself, analysts cap the perpetual growth rate at or below long-term nominal economic growth (real growth plus inflation), typically around 2%–3%. For reference, the Federal Reserve’s June 2026 projections put longer-run real GDP growth at about 2.0% and longer-run inflation at 2.0%, which implies nominal growth of roughly 4%, so a 2%–3% rate sits comfortably below that ceiling.
The second approach is the Exit Multiple Method, which estimates what the business could be sold for at the end of the forecast window using a market ratio:
Terminal Value = Final Year Metric * Exit Multiple
In this formula, the final year metric is often an operating profit measure such as EBITDA (earnings before interest, taxes, depreciation, and amortization), and the exit multiple is a matching valuation ratio, such as enterprise value divided by EBITDA, drawn from similar public companies.
Method
Core Assumption
Best Fit
Perpetual Growth
Cash flows grow at a steady, low rate forever
Stable, mature businesses with predictable cash generation
Exit Multiple
The business is valued at a market multiple in year 5 or 10
Companies in industries with clear, comparable market multiples
To see the perpetual growth math in action, imagine a company expected to generate $100 million in free cash flow in year 5. If an analyst assumes a 2.5% perpetual growth rate and an 8.5% discount rate, the math works out to:
$100 million * 1.025 / (0.085 − 0.025) = $102.5 million / 0.06 = $1,708 million
That $1.71 billion figure is the estimated end-of-forecast value at year 5, which the analyst then discounts back to today alongside the first 5 years of cash flows.
Stacked bar chart comparing near-term 5-year cash flows with a larger terminal value share
Why Terminal Value Matters for Growth vs. Value Stocks
This estimate matters because it often accounts for the largest share of a company’s total estimated worth in a DCF model, and an even larger share for young growth companies. When one estimate carries that much weight, understanding where a company’s cash flows sit on the calendar helps explain why different stocks behave the way they do.
This split is especially clear when comparing growth vs. value stocks. A mature value company, such as a utility or consumer staples maker, already generates steady cash today, so a meaningful share of its worth comes from the next few years rather than the distant horizon.
A young growth company often looks the exact opposite. It may reinvest every dollar into new software, factories, or customers today, generating little or no free cash flow during the first 5 years. Almost all of its estimated worth sits inside its long-term value 10 or more years down the road.
That timeline difference explains why growth stocks tend to swing more sharply when interest rates move. Higher interest rates push up the discount rate analysts use, and a higher discount rate shrinks the present value (what future money is worth in today’s dollars) of distant terminal cash flows far more than that of near-term cash payouts.
Common Mistakes and the Trap of False Precision
Because this estimate comes out of a clean mathematical formula, it is easy to mistake a precise-looking spreadsheet output for a reliable prediction. In reality, small changes in the inputs can move the final figure dramatically.
In practice, many long-term investors find that building a DCF spreadsheet teaches them how a business makes money, yet relying on a single figure as a strict buy price often leads to misplaced confidence when real-world conditions shift.
Watch out for 3 common traps when reading analyst valuations built on this estimate:
Anchoring on a single price target: A formula that outputs "$1,708 million" feels exact, but it is built entirely on educated guesses about what the world will look like a decade from now.
Plugging in aggressive growth rates: Raising the perpetual growth rate by just 1 or 2 percentage points inflates this figure sharply, even though few businesses sustain above-average growth over multiple decades.
Overlooking discount-rate sensitivity: Using our earlier $100 million cash-flow example, if the discount rate rises by just 1 percentage point, from 8.5% to 9.5% while growth stays at 2.5%, the estimate falls from $1,708 million to $1,464 million. A single percentage-point shift wipes out 14% of the estimate.
For everyday investors, this sensitivity is a helpful reminder that you do not need to calculate it yourself to invest well. If you hold a broadly diversified index fund or ETF over many years, you automatically own hundreds of businesses across different stages of growth without needing to forecast any single company's distant cash flows. Fund expense ratios and trading fees still compound over a long holding period, so they are worth comparing before you choose a fund.
Conclusion
Terminal value estimates what a business is worth beyond an analyst's multi-year forecast, and it often drives the largest share of a discounted cash flow valuation. While the concept helps explain why fast-growing stocks react so strongly to changing interest rates, the formula is highly sensitive to long-term assumptions that nobody can predict with certainty.
When you are ready to compare platforms for holding your long-term investments, our broker reviews are a practical place to start. Every stock investment carries the risk of losing money and valuation models are never guaranteed, so treat this guide as educational background rather than personal financial advice.
FAQ
5 questions
What is the difference between terminal value and net present value (NPV)?
Terminal value estimates what a business will be worth at the end of a 5- to 10-year forecast window, capturing all cash flows beyond that point. Net present value takes every projected cash flow—both the near-term forecast years and the end-of-forecast value—and discounts them all back into today's dollars, subtracting any upfront investment cost to show whether an investment adds value today.
Can terminal value ever be negative?
Yes, it can be negative in 2 situations. First, if a business is expected to lose cash indefinitely, its projected future cash flows have negative value. Second, in the perpetual growth formula, entering a growth rate higher than the discount rate produces a negative denominator—which signals a broken assumption rather than a real valuation, since no company can outgrow the economy forever.
What is a realistic perpetual growth rate for terminal value?
Analysts typically choose a perpetual growth rate between 2% and 3%, roughly matching long-term inflation and overall economic growth. Setting the rate much higher implies the company would eventually grow larger than the entire economy, which is impossible over an infinite timeline. For mature or slower-growing industries, analysts often use an even lower rate, closer to expected inflation alone.
Do everyday index fund investors need to calculate terminal value?
No, individual investors who buy broad index funds or diversified ETFs do not need to calculate it themselves. Market prices are generally thought to reflect the combined estimates of many institutional analysts, and holding a broad basket of companies spreads out the risk that any single company's long-term cash flow forecast turns out to be wrong.
Why is terminal value calculated at the end of a 5- or 10-year period?
Financial analysts usually limit detailed year-by-year revenue and expense forecasts to 5 or 10 years because predicting exact business conditions further ahead becomes guesswork. Grouping all subsequent years into a single long-term estimate keeps discounted cash flow models practical while still accounting for the ongoing earnings power of a business that plans to operate indefinitely.
Disclaimer
This guide was written with AI assistance and reviewed by the StockEmber editorial team for accuracy. StockEmber provides independent education, not personal financial advice. Investing puts your capital at risk: the value of investments can go down as well as up, you may get back less than you invest, and past performance doesn’t guarantee future results. Some links may support our work at no additional cost to you.
The StockEmber Team is our in-house desk of independent research writers. We test brokerage platforms, read the fine print on fees and custody, and cover ETFs and long-horizon investing for people who plan to hold for decades — not days.