Operating cash flow measures how much real money a business generates from its core daily activities—selling goods or services and paying regular operating bills—over a set period. Unlike net income, it removes non-cash accounting charges like depreciation and adjusts for unpaid customer invoices and inventory changes. It does not include cash from bank loans, stock sales, or major equipment spending.
Operating cash flow (OCF) is the actual cash a company brings in from its normal, day-to-day business operations, after paying routine running costs like wages, rent, and inventory.
A business can report strong accounting profits on paper while its bank balance quietly shrinks. For long-term investors, knowing whether a company turns sales into real money matters far more than a single quarter of headline earnings. This guide explains the operating cash flow meaning, how the numbers work, and where this measure can mislead you.
Quick Takeaways
01Positive OCF shows a business can pay its everyday bills without leaning on new loans or share sales.
02Accounting profit often differs from cash from operations because non-cash charges and unpaid customer invoices distort net income.
03Strong OCF does not equal leftover cash for shareholders, since it leaves out major spending on buildings and equipment.
04Checking multi-year cash trends alongside free cash flow gives buy-and-hold investors a clearer view of business health than any single quarter.
What Is Operating Cash Flow?
Operating cash flow measures the net cash a company generates strictly from selling its core products or services and paying its everyday operating bills.
When you start investing in stocks, you will see that public companies publish 3 main financial reports each quarter: the income statement, the balance sheet, and the cash flow statement. The cash flow statement tracks real money moving in and out of the business across operating, investing, and financing activities.
This measure sits at the top of that report. It strips out one-off events like selling a factory, borrowing from a bank, or issuing new shares, leaving a plain look at whether the core business brings in more cash than it spends to run.
How OCF Works
Companies calculate OCF either by adding up actual cash receipts and payments directly or by adjusting net income for non-cash items and working capital shifts.
Most public companies use the indirect method, which starts at the bottom of the income statement and adjusts back to cash. Here is the standard OCF formula:
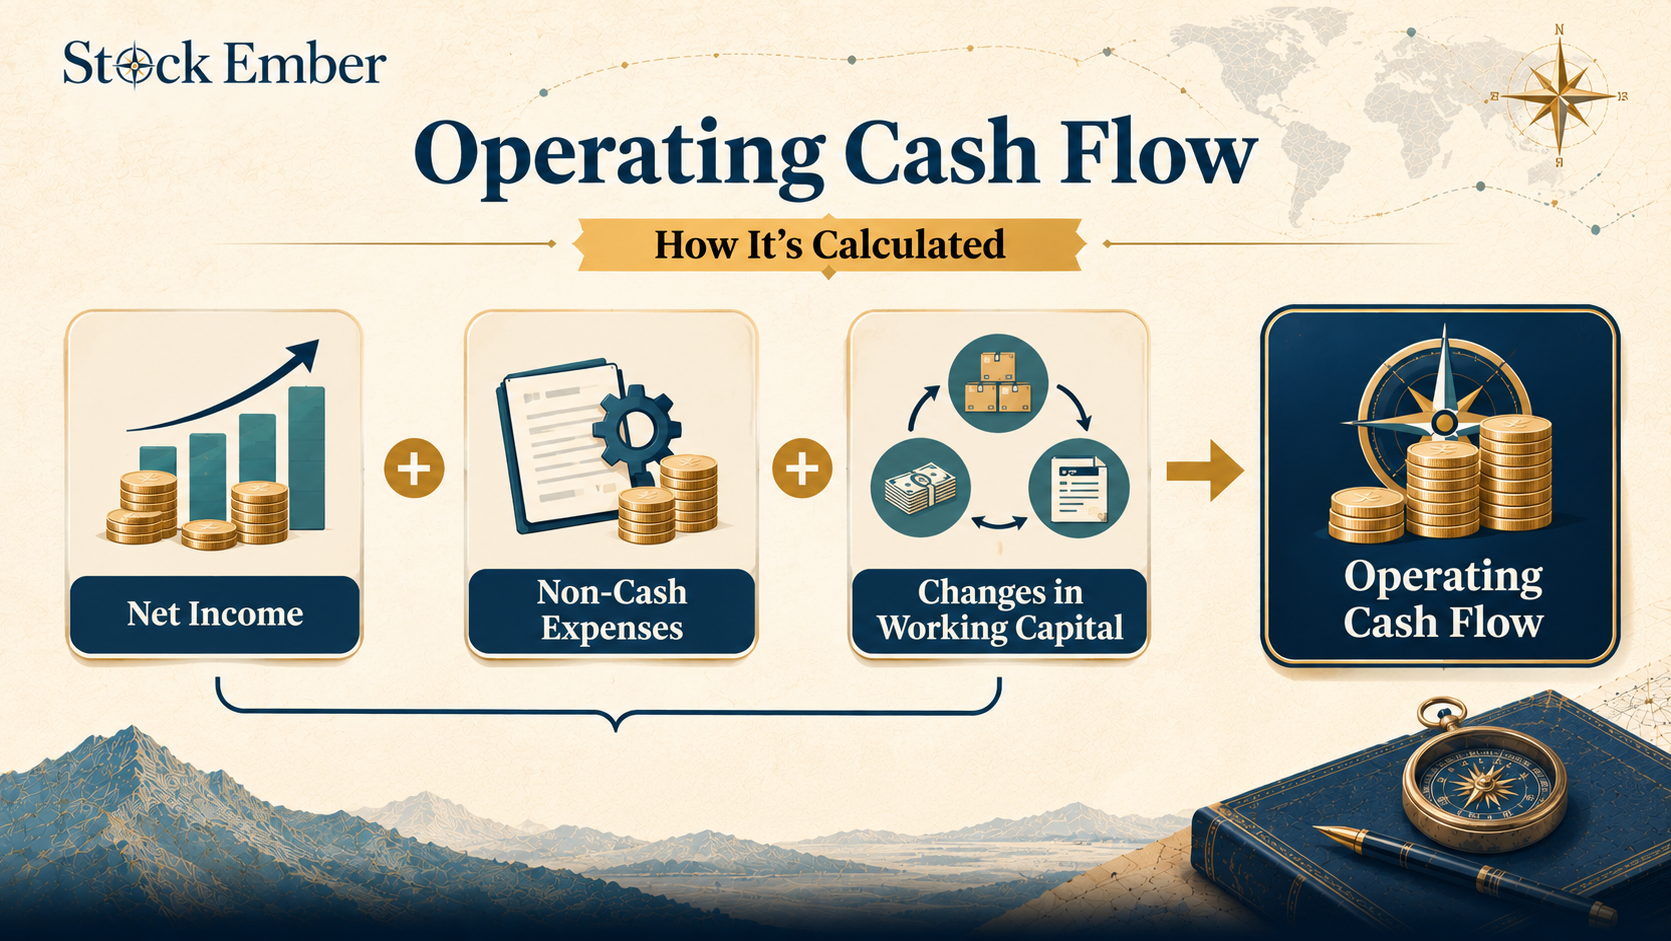
OCF = Net Income + Non-Cash Expenses ± Changes in Working Capital
Here, net income is bottom-line accounting profit after all expenses and taxes, non-cash expenses are paper charges that did not use cash during the period, and working capital reflects short-term shifts in customer bills, inventory, and supplier invoices.
Flow from net income and working capital changes to operating cash flow
With operating cash flow explained step by step, 2 adjustments do most of the work:
Non-cash expenses: Charges like depreciation (spreading the cost of physical equipment over its useful life) and amortization (spreading the cost of intangible assets like software or patents over time) reduce accounting profit even though no cash left the bank, so they are added back.
Changes in working capital: When accounts receivable (money customers owe for delivered goods) rises, cash is tied up in unpaid bills and must be subtracted. When accounts payable (bills the company owes to suppliers) rises, the company holds onto its cash longer, so that increase is added back.
Consider a hypothetical example. Suppose Harbor Tools reports $10 million in net income and records $2 million in depreciation. On paper, cash generation looks like $12 million.
However, Harbor Tools shipped large orders late in the year, causing unpaid customer invoices to jump by $5.5 million. Subtracting that $5.5 million leaves an OCF of $6.5 million, well below its reported profit. (A small share of companies instead use the direct method, which totals cash collected from customers minus cash paid to suppliers and staff to reach the exact same figure.)
OCF vs. Net Income
OCF tracks actual money moving through the bank account, whereas net income reflects accounting profit recorded under accrual rules.
Under accrual accounting (recording revenue when a sale is earned rather than when cash arrives), a company books a sale the day an invoice goes out. If customers take 90 days to pay, or default, net income looks healthy long before a dollar hits the bank.
Over a 10-year holding period, that gap matters. Dividends, debt repayments, and new product launches all require real cash, not accounting entries. A business whose net income climbs while its OCF stalls may be relying on slow-paying buyers rather than genuine cash demand.
In practice, many long-term investors compare OCF against net income over a 5-to-10-year stretch rather than reacting to one noisy quarter, because seasonal inventory builds and late customer payments usually smooth out over a full business cycle.
OCF vs. Free Cash Flow
OCF shows the cash left after running daily operations, while free cash flow subtracts the capital spending needed to maintain and grow the business.
That distinction is important in capital-heavy industries. An airline, utility, or manufacturer might generate billions in OCF, only to spend nearly every dollar replacing aging planes, power lines, or factory machines. Those big-ticket outlays are called capital expenditures (long-term spending on buildings, equipment, and property), and they appear lower down on the cash flow statement rather than inside OCF.
Measure
What It Tracks
What It Leaves Out
Net Income
Accounting profit after all expenses and taxes
Unpaid customer bills, inventory shifts, and capital spending
Operating Cash Flow
Cash generated by day-to-day business operations
Big-ticket spending on long-term equipment and property
Free Cash Flow
Operating cash left after paying capital expenditures
Financing choices like dividends, share buybacks, or debt payoff
Once you see how much cash remains after those equipment bills, valuation tools like free cash flow yield help compare a company's leftover cash against its total market value.
Common Mistakes When Reading OCF
Treating a single year of positive OCF as proof of financial safety is one of the easiest traps for stock investors.
Watch out for 3 common blind spots when reviewing a company's cash numbers:
Confusing operating cash with leftover cash: In industries that require constant equipment upgrades, strong OCF can still leave zero free cash flow once capital bills are paid.
Missing short-term working-capital tricks: A company can temporarily boost OCF by delaying payments to its own suppliers or selling down inventory without restocking. Both moves pull cash forward from future quarters and eventually reverse.
Misreading a company's growth stage: Young, fast-growing firms often report negative OCF while scaling, whereas a shrinking business can post positive OCF simply by starving itself of new investment.
If you invest mainly through broad index funds or exchange-traded funds, you do not need to track this measure company by company, because wide diversification spreads single-business risks across hundreds of holdings. Even when you own individual shares, strong historical cash generation never shields a stock from market drops or promises future gains.
Conclusion
OCF cuts through accounting adjustments to show whether a company's core business actually brings in cash. Comparing it with net income and free cash flow helps you spot durable cash engines as well as businesses whose paper profits mask heavy equipment bills or rising unpaid invoices.
When you are ready to put your research into practice and choose an account for long-term investing, explore our broker reviews to compare platforms. Every stock investment puts your money at risk and past cash generation never promises future results, so treat this guide as educational background rather than personal financial advice.
FAQ
5 questions
What is the difference between EBITDA and operating cash flow?
EBITDA measures earnings before interest, taxes, depreciation, and amortization, which makes it an accounting profit estimate rather than a true cash figure. OCF goes further by accounting for actual taxes paid, interest costs, and changes in working capital like unpaid customer bills and inventory. Because EBITDA ignores cash tied up in daily operations, a company can report strong EBITDA while bringing in very little cash.
What is a good operating cash flow ratio?
The operating cash flow ratio divides OCF by current liabilities—the bills and short-term debts due within 1 year. A ratio above 1.0 generally means the business generates enough cash from daily operations to cover its near-term obligations without borrowing. Because normal cash needs vary by industry, investors usually compare a company's ratio against its direct peers and its own multi-year track record rather than using one universal cutoff.
Where do you find OCF on a company's financial statements?
You can find this figure in the top section of a company's cash flow statement, usually labeled cash flows from operating activities. Public companies include this report in their quarterly and annual filings right alongside the income statement and balance sheet. The final subtotal at the bottom of that first section shows the total cash generated or used by core business operations during the period.
Can a profitable company have negative operating cash flow?
Yes, a business can report positive net income while posting negative operating cash flow. This often happens when sales grow rapidly on credit, leaving cash locked in unpaid customer invoices, or when a company spends heavily to build up warehouse inventory before products sell. Over a single quarter, that gap can reflect normal growth, but persistent negative operating cash flow alongside rising accounting profits is a warning sign.
How is OCF different from investing and financing cash flows?
A cash flow statement splits money movement into 3 buckets. OCF tracks cash from daily business activity, such as collecting customer payments and paying staff or suppliers. Investing cash flow covers buying or selling long-term assets like factories, equipment, and securities. Financing cash flow records transactions with lenders and shareholders, including issuing stock, taking on or repaying debt, and paying dividends.
Disclaimer
This guide was written with AI assistance and reviewed by the StockEmber editorial team for accuracy. StockEmber provides independent education, not personal financial advice. Investing puts your capital at risk: the value of investments can go down as well as up, you may get back less than you invest, and past performance doesn’t guarantee future results. Some links may support our work at no additional cost to you.
The StockEmber Team is our in-house desk of independent research writers. We test brokerage platforms, read the fine print on fees and custody, and cover ETFs and long-horizon investing for people who plan to hold for decades — not days.