Stock fundamentals are the key quantitative financial metrics and qualitative business traits that reveal a company's true intrinsic value. They include balance sheet assets, revenue, operating cash flow, and competitive advantages that sustain long-term profitability. Evaluating these metrics helps investors determine whether a stock's market price aligns with its underlying economic health
These business fundamentals are the core financial metrics and underlying qualities that determine a public company's intrinsic value. They reveal whether a business generates consistent profits, manages debt safely, and maintains a competitive market position.
When you evaluate a business, stock market fundamentals help you look past daily price noise to see what the enterprise actually earns and owns. Understanding these core concepts empowers long-term accumulators to spot financially sound companies while avoiding overvalued businesses.
This guide explains how key financial statements work, which metrics matter most, and how to evaluate business health over a multi-year horizon.
Quick Takeaways
01Stock fundamentals measure a company's financial health through earnings, cash flow, debt levels, and competitive advantages.
02Quantitative fundamentals rely on verified data from income statements, balance sheets, and cash flow reports.
03Qualitative factors like brand strength and leadership quality determine how long a company can defend its profits.
04Evaluating fundamentals gives buy-and-hold investors a grounded baseline that lasts through short-term market downturns.
What Are Stock Fundamentals?
Stock fundamentals represent the foundation of fundamental analysis, the practice of evaluating a company's underlying financial health to determine its real business value. Rather than predicting short-term share price movements based on trading patterns, fundamental analysis asks a simple question: Is this business financially strong and likely to grow over time?
Fundamentals fall into two primary categories: quantitative and qualitative. Quantitative fundamentals consist of measurable numbers found in quarterly and annual corporate reports, such as revenue, net income, cash reserves, and outstanding debt. Qualitative fundamentals include non-numerical factors like brand strength, customer loyalty, management experience, and regulatory protection. Combined, these elements tell investors whether a stock price accurately reflects the underlying worth of the company.
The Core Quantitative Pillars: Reading Financial Statements
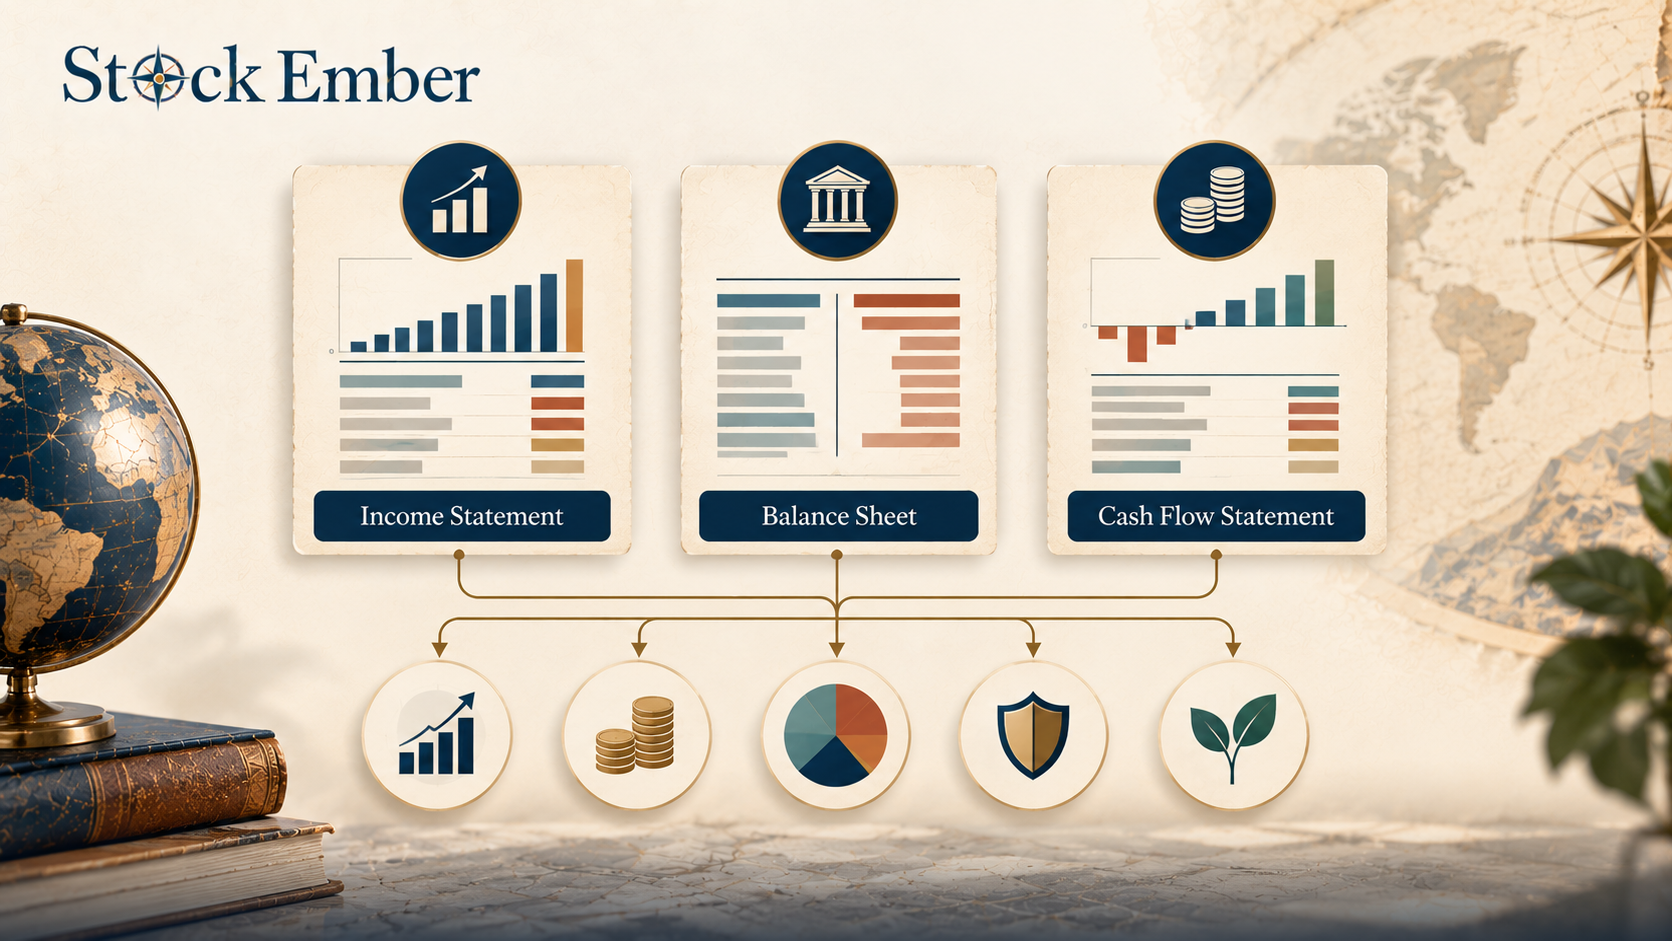
To evaluate quantitative fundamentals, investors rely on three financial statements filed regularly with market regulators:
The Income Statement: Reports a company's revenue, operating expenses, and net profit over a specific period (such as a quarter or a year). It reveals whether the core business model generates actual earnings.
The Balance Sheet: Shows a snapshot of assets (what the company owns) and liabilities (what it owes) at a single point in time. The remaining difference is equity, representing net assets owned by shareholders.
The Cash Flow Statement: Tracks actual cash entering and leaving the company across operating, investing, and financing activities. It confirms whether reported net profits convert into real spendable cash.
As outlined in financial reporting guidelines from the SEC, reviewing these statements together prevents single-metric distortions. For example, a company might report high net earnings on its income statement while draining cash on its cash flow statement due to unpaid customer bills.
Diagram illustrating the three core financial statements used in stock fundamental analysis.
Key Ratios Every Investor Should Know
Financial ratios convert raw accounting numbers into standardized figures that make comparing different companies straightforward. Here are three foundational ratios every long-term investor should know:
Price-to-Earnings (P/E) Ratio: Compares share price to annual earnings per share. It shows how much investors pay per dollar of company profit.
P/E Ratio = Share Price / Earnings Per Share
Price-to-Book (P/B) Ratio: Compares market value to net accounting equity. It indicates how much investors pay per dollar of net assets on the balance sheet.
P/B Ratio = Share Price / Book Value Per Share
Debt-to-Equity (D/E) Ratio: Compares total liabilities to shareholder equity. It measures how much debt a company uses to finance its operations relative to owner funds.
Debt-to-Equity Ratio = Total Liabilities / Shareholders' Equity
Ratio
Formula Recap
Example Application
P/E
Share Price / EPS
A company trading at $50 per share with $2.50 EPS has a P/E ratio of 20.
P/B
Share Price / Book Value
A stock priced at $60 with a book value of $30 per share has a P/B ratio of 2.
D/E
Total Liabilities / Equity
A firm with $2 million in liabilities and $4 million in equity has a D/E ratio of 0.5.
Comparing these ratios against direct industry rivals or historical broad-market averages helps clarify whether a stock trades at a sensible valuation.
Quantitative vs. Qualitative Fundamentals: Beyond the Numbers
While balance sheet numbers show what a company achieved in the past, qualitative traits help predict whether it can protect its profits in the future.
A business can display stellar income numbers today, but if competitors can easily copy its product, those earnings will erode over time. Long-term investors look for a qualitative "economic moat", a durable competitive advantage that keeps rivals at bay. Examples include strong brand recognition, high customer switching costs, exclusive patents, or scale advantages that lower unit production costs.
Qualitative analysis also examines corporate governance and management capital allocation. Evaluating whether leaders reinvest cash wisely, maintain reasonable executive compensation, or respect minority shareholder rights provides critical context that financial statement numbers alone cannot capture.
Why Stock Fundamentals Matter for Buy-and-Hold Investors
For long-term accumulators, underlying company health acts as an anchor during turbulent market conditions. Share prices move wildly over short periods due to market sentiment, interest rate changes, or macroeconomic headlines. Over ten-year compounding windows, however, stock prices reliably follow underlying corporate earning power and cash generation.
In practice, long-term investors find that reviewing basic balance sheet debt levels once or twice a year provides far more clarity than watching daily stock tickers, preventing panic selling during standard market pullbacks.
When investing in stocks for compounding wealth, grounding your decisions in fundamental analysis ensures that you build a portfolio of durable real-world businesses rather than chasing speculative price momentum.
Common Fundamental Analysis Pitfalls
Even thorough fundamental research can lead investors astray if common valuation traps are overlooked:
The Value Trap: A stock trading at a very low P/E or P/B ratio may look like a cheap opportunity, but the low price often reflects permanent operational decline or excessive debt obligations.
Ignoring Accounting Distortions: One-time asset sales or aggressive revenue recognition can temporarily inflate net profit on the income statement. Always cross-check reported earnings against operating cash flow.
Failing to Recognize Restructuring Signs: When struggling companies face plummeting stock prices and potential stock exchange delisting, management may perform a reverse stock split to artificially raise the per-share price. A reverse split changes share counts, but it does not improve underlying balance sheet health or resolve fundamental operational troubles.
Conclusion
Stock fundamentals provide the core blueprint for evaluating company health, combining financial statement data with qualitative competitive moats. By analyzing revenue growth, cash flow quality, debt levels, and industry positioning, long-term investors can assess intrinsic value beyond short-term market price fluctuations.
When you are ready to apply fundamental research tools in your investment account, our broker reviews can help you select a trading platform with comprehensive financial research features.
Every stock investment carries capital risk, and past financial performance offers no guarantee of future returns, so always use fundamental analysis as part of a diversified multi-asset strategy.
FAQ
5 questions
What are the main stock fundamentals?
The main quantitative stock fundamentals include revenue, net profit, earnings per share (EPS), operating cash flow, balance sheet equity, and debt levels. Qualitative fundamentals include brand strength, management capability, economic moats, and industry growth potential.
What is the difference between fundamental and technical analysis?
Fundamental analysis evaluates a company's underlying financial health, business model, and competitive edge to determine intrinsic value over a long-term horizon. Technical analysis studies historical price movement, trading volume, and chart patterns to forecast short-term price trends.
How do you analyze a stock's fundamentals?
Analyzing stock fundamentals begins by reviewing the three primary financial statements: the income statement, balance sheet, and cash flow statement. Investors calculate key valuation and leverage ratios, such as P/E, P/B, and Debt-to-Equity, and compare them against industry peers.
What are qualitative fundamentals in stock investing?
Qualitative fundamentals are non-numerical factors that influence a business's long-term success. These include competitive moats (like patents or brand loyalty), executive leadership quality, regulatory environment, corporate governance, and brand equity.
Can a stock have good fundamentals and still fall in price?
Yes. Stock prices can decline despite strong fundamental health due to broader market sell-offs, macroeconomic headwinds, interest rate changes, or short-term shift in investor sentiment. Over extended multi-year periods, however, stock prices generally converge with underlying business performance.
Disclaimer
This guide was written with AI assistance and reviewed by the StockEmber editorial team for accuracy. StockEmber provides independent education, not personal financial advice. Investing puts your capital at risk: the value of investments can go down as well as up, you may get back less than you invest, and past performance doesn’t guarantee future results. Some links may support our work at no additional cost to you.
The StockEmber Team is our in-house desk of independent research writers. We test brokerage platforms, read the fine print on fees and custody, and cover ETFs and long-horizon investing for people who plan to hold for decades — not days.