Portfolio turnover measures the percentage of an investment fund's assets that are replaced over a single year. It is calculated by dividing the lesser of total securities bought or sold by the average Net Asset Value (NAV). Higher turnover indicates active trading, which introduces hidden transaction friction and potential capital gains taxes.
It measures how frequently an investment fund buys and sells its underlying holdings over a single year, expressed as a percentage of the fund's total assets.
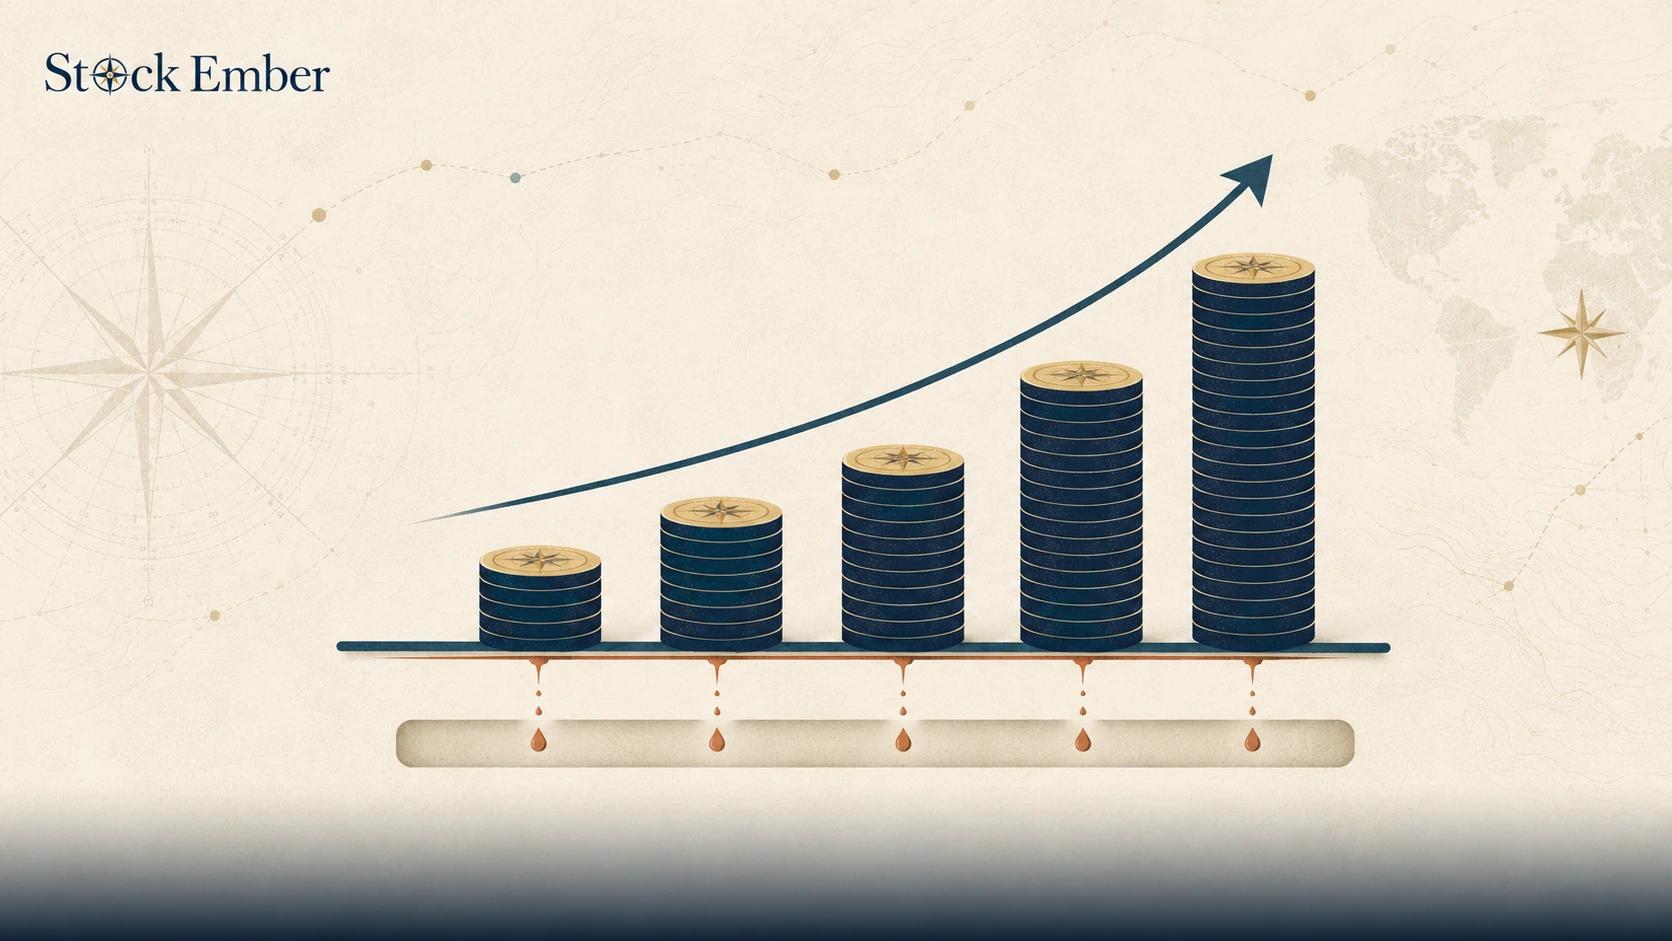
When a fund manager buys and sells stocks constantly, those transactions generate quiet expenses behind the scenes. Over a ten-year horizon, hyperactive trading can eat into your compounding returns through transaction costs and unexpected tax bills. This guide covers how turnover is calculated, why hidden friction matters, and how to evaluate turnover rate before investing.
Quick Takeaways
01This metric reflects how much of a fund's portfolio changes every 12 months.
02High turnover creates trading friction, including brokerage commissions and market impact, that are omitted from a fund's published expense ratio.
03Frequent trading in taxable accounts triggers capital gains distributions, generating uninvited tax bills for shareholders.
04Index funds typically keep turnover below 5%, whereas active strategies often exceed 50% to 100% annually.
What Is Portfolio Turnover?
To understand this concept, imagine a fund holding 100 stocks. If the manager sells 50 of those stocks over the year and replaces them with 50 new ones, the fund has replaced half its portfolio.
The portfolio turnover meaning centers on trading frequency. A high percentage shows that the fund manager trades actively, swapping positions in search of short-term opportunities. A low percentage indicates a patient, buy-and-hold approach.
When evaluating overall mutual fund fees, many investors look only at the annual management charge. However, understanding the portfolio turnover rate meaning is equally important. What does portfolio turnover mean for your practical returns? It signals how much invisible trading activity is happening inside the fund, which directly affects long-term performance.
How Portfolio Turnover Is Calculated
This ratio measures fund trading using a standardized annual formula. Regulators require funds to calculate it by looking at total buys and total sells over the past 12 months.
To prevent artificial inflation from large investor cash deposits or withdrawals, the formula uses the lesser of total stock purchases or total stock sales:
Portfolio Turnover Ratio = Lesser of Total Securities Purchased or Sold / Average Net Asset Value
For example, suppose a fund maintains an average Net Asset Value (NAV) of $100 million over the year. During that period, the manager buys $30 million in new stocks and sells $20 million in existing stocks.
Identify the lesser value: $20 million (sales) is smaller than $30 million (purchased).
Divide by average assets: $20 million divided by $100 million equals 0.20.
Convert to a percentage: 20%.
Under standard guidelines set by institutions like the US Securities and Exchange Commission, or SEC regulations, this 20% rate means one-fifth of the fund's portfolio was replaced during the year.
Why Portfolio Turnover Matters for Long-Term Investors
Turnover is not automatically bad, but high trading activity creates two major financial headwinds that compound over time.
1. Hidden Trading Friction
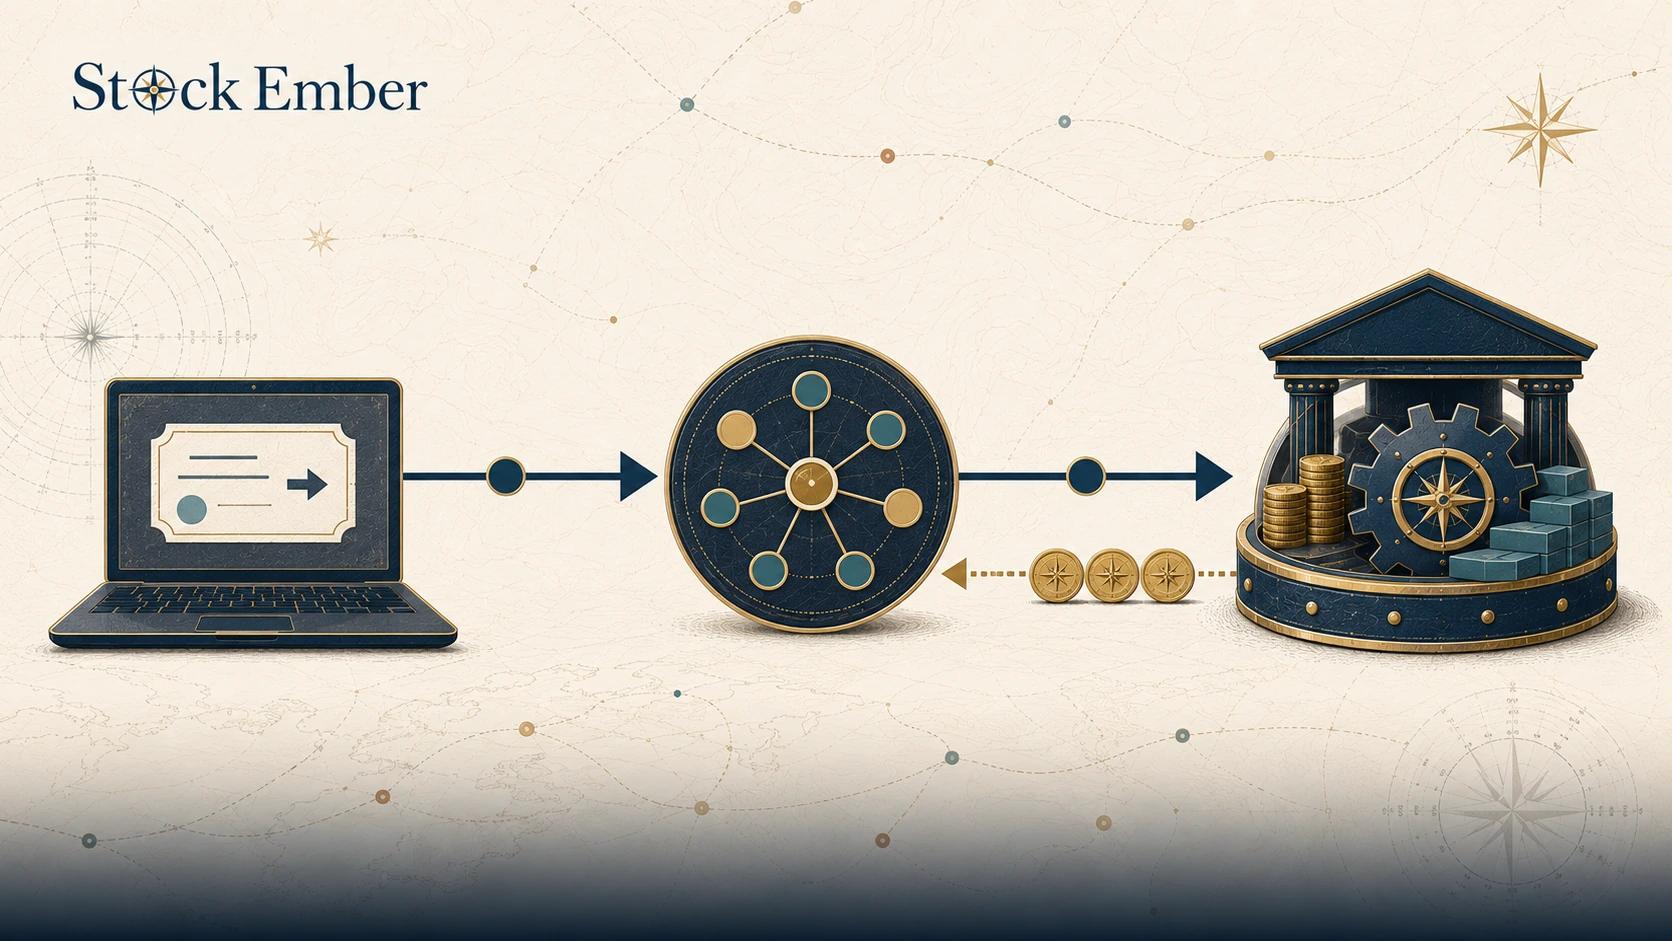
Every time a fund trades a stock, it incurs expenses. These include stockbroker commissions, bid-ask spreads, and market impact costs (where large orders move the share price unfavorably).
Importantly, internal trading costs are subtracted directly from the fund's asset value. They are not included in the published expense ratio or listed beside standard costs like a front-end load. Over ten years, a fund with high trading friction can quietly surrender 1% to 2% in total annual return compared to a low-turnover baseline.
2. Capital Gains Tax Drag
When a fund manager sells a stock at a profit, that gain is realized inside the fund. By law, mutual funds must pass net realized capital gains on to shareholders at year-end.
If you hold the fund in a taxable brokerage account, you owe taxes on those capital gains distributions in the year they occur, cutting into the money that would otherwise remain invested.
Active vs. Passive Funds: The True Cost Difference
The table below contrasts typical turnover characteristics across investment styles:
Feature
Passive Index Funds
Active Management Funds
Typical Turnover Rate
1% – 5%
30% – 100%+
Trading Friction
Very low
Moderate to high
Tax Efficiency
High (rare gain distributions)
Low (frequent taxable events)
Primary Objective
Track a broad market index
Beat a market benchmark
Source: Typical turnover ranges compiled from Morningstar fund category averages.
Passive index funds hold stocks to match a market index, changing positions only when the index composition changes. Active funds trade frequently as managers attempt to time market swings, multiplying transaction costs along the way.
Common Portfolio Turnover Pitfalls to Watch
Assuming the expense ratio tells the whole story: A fund might list a low management fee of 0.50%, but if its turnover is 120%, hidden trading costs can double its actual expense drag over a ten-year holding period.
Holding hyperactive funds in taxable accounts: Placing high-turnover funds inside taxable accounts creates recurring tax bills. High-turnover strategies belong inside tax-advantaged accounts like IRAs or pensions whenever possible.
Confusing turnover with poor performance: High turnover is not a guaranteed failure. Some specialized momentum or arbitrage strategies require rapid trading to capture value. The key is ensuring the net returns justify the extra friction.
Conclusion
This metric reveals how aggressively a fund trades behind the curtain. For long-horizon investors, choosing low-turnover funds minimizes invisible brokerage costs and avoids unexpected capital gains taxes. Checking this single metric helps ensure that more of your money stays invested and compounding over the long run.
When you are ready to evaluate how small percentage costs impact your long-term wealth, our financial calculators can help you model your ten-year compounding trajectory. Investing always puts your money at risk and past fund activity does not promise future trading patterns, so treat this guide as a starting point for your own research, not a recommendation.
FAQ
5 questions
What is considered a good portfolio turnover rate?
This rate depends on the fund's strategy, but lower is generally better for long-term buy-and-hold investors. According to Morningstar's fund category data, passive index funds typically maintain a turnover rate under 5%, minimizing transaction costs and taxes. Active funds often exceed 50%, which is only worthwhile if the manager consistently delivers outperformance after accounting for hidden trading friction.
Is high portfolio turnover good or bad?
High turnover is not automatically bad, but it creates financial friction through brokerage commissions, bid-ask spreads, and taxable capital gains distributions. For taxable brokerage accounts, high turnover often leads to drag on overall compounding. However, in tax-advantaged accounts or specialized active momentum strategies, higher turnover may be acceptable if net returns justify the added trading expenses.
Are turnover transaction costs included in a fund's expense ratio?
No, internal trading commissions and market impact costs generated by this trading activity are not included in a mutual fund or ETF's published expense ratio. They are deducted directly from the fund's Net Asset Value (NAV). As a result, a fund with a low expense ratio but high turnover can carry significantly higher hidden costs than its fee label suggests.
How does portfolio turnover trigger capital gains taxes?
When a fund manager sells underlying securities at a profit to turn over the portfolio, those realized capital gains must be distributed to fund shareholders at year-end by law. If you hold the fund in a taxable account, you must pay taxes on these distributions, even if you did not sell any of your fund shares or if the fund's overall share price decreased.
How often do index funds turnover their underlying holdings?
Broad market index funds usually have very low turnover, often between 1% and 5% annually. Because index funds simply buy and hold assets to match a target index, they only sell securities when the index composition changes, such as when a company is replaced or during scheduled rebalancing. This low turnover helps keep trading expenses and tax liabilities minimal.
Disclaimer
This guide was written with AI assistance and reviewed by the StockEmber editorial team for accuracy. StockEmber provides independent education, not personal financial advice. Some links may support our work at no additional cost to you.
The StockEmber Team is our in-house desk of independent research writers. We test brokerage platforms, read the fine print on fees and custody, and cover ETFs and long-horizon investing for people who plan to hold for decades — not days.