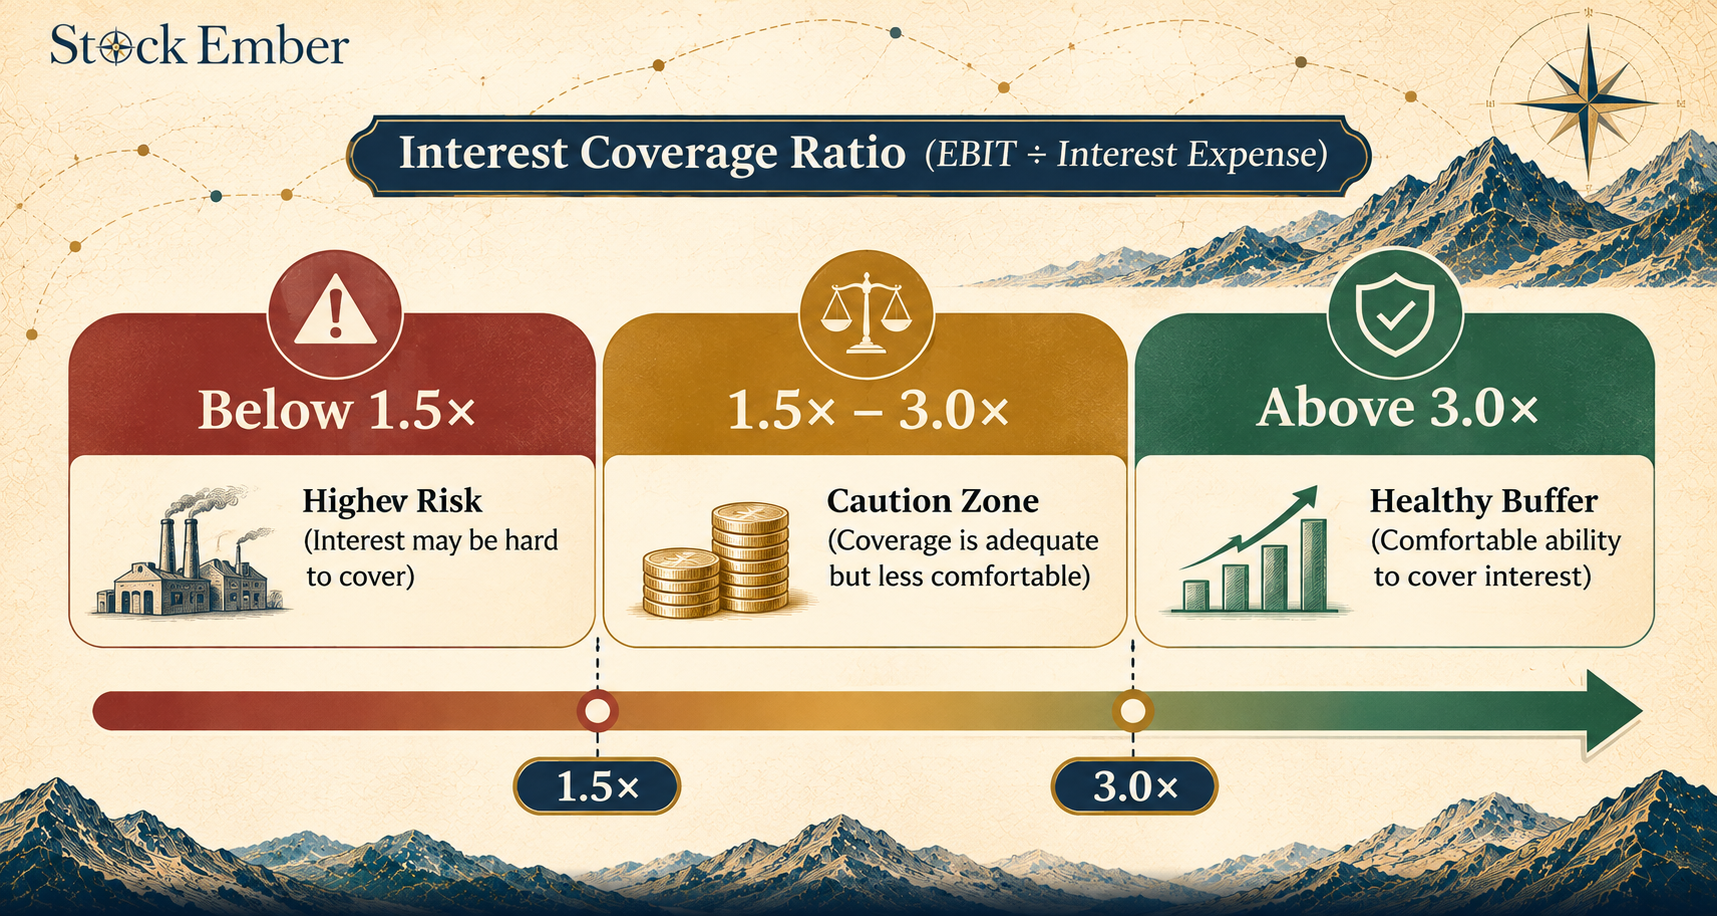
The interest coverage ratio evaluates a company's financial safety by comparing its operating profit (EBIT) directly to its annual debt interest expenses. It shows investors how many times a business can meet its contractual borrowing costs before running into financial distress.
This ratio measures how easily a company can pay the interest due on its outstanding debt using its operating profit. It shows investors whether a business produces enough earnings to handle its debt costs during normal operations.
When you buy an individual stock, corporate debt is often invisible until market conditions turn sour. A business can report steady sales while piling up interest charges that eat away at future shareholder returns. Knowing how to evaluate debt safety helps you spot vulnerable balance sheets before serious financial trouble arrives.
This guide breaks down how the metric works, where standard accounting figures mislead, and what it means for your portfolio.
Quick Takeaways
01This metric compares operating profit directly to debt interest expenses to measure financial safety.
02Ratios below 1.5x are commonly treated as a sign of higher credit risk, while ratios above 3.0x are generally viewed as a healthy operating buffer, though acceptable levels vary by industry.
03Operating income is an accrual accounting figure, meaning paper profits do not guarantee actual cash in the bank.
04Heavy interest service drains capital that would otherwise compound for shareholders over a multi-year holding period.
What Is the Interest Coverage Ratio and What Does It Measure?
This ratio evaluates balance sheet safety by measuring how many times a company's operating profit covers its annual interest charges. If you are searching for “what is the interest coverage ratio” or its “interest coverage ratio meaning,” the short answer is that the ratio works primarily as a solvency check. Creditors, rating agencies, and equity investors rely on it to gauge whether a firm produces enough profit to avoid default.
In financial statements, the metric is often called times interest earned (TIE). It focuses on core operations by examining earnings before interest and taxes (EBIT). This separates operating performance from tax structures and borrowing arrangements.
By isolating operating profit, the metric reveals how much profit could fall before the business fails to pay lenders. A wider gap between earnings and interest gives the company room to absorb economic downturns or rising costs without defaulting.
How the Formula Works: Calculating Coverage
The standard formula calculates debt protection by dividing operating earnings by annual interest expense.
Interest Coverage Ratio = Operating Income (EBIT) / Interest Expense
To calculate the ratio, pull 2 line items from an income statement:
Operating Income (EBIT): Revenue minus cost of goods sold and operating expenses, reflecting everyday business profit.
Interest Expense: The cumulative interest owed on short-term debt, bonds, credit lines, and long-term loans.
For example, assume a manufacturing company reports $15 million in operating income for the year, while its debt generates $3 million in interest charges.
Using the formula: $15,000,000 / $3,000,000 = 5.0x.
This 5.0x ratio indicates the company produces $5 of operating profit for every $1 of interest owed. Operating earnings could drop by 80% before the business would struggle to meet its interest commitments.
Investors interpret coverage ratios using several baseline thresholds:
Above 3.0x: Generally viewed as comfortable, providing an adequate buffer against downturns, though acceptable levels vary by industry and lender.
Between 1.5x and 3.0x: Acceptable in stable industries, but leaves little margin during a slump.
Between 1.0x and 1.5x: Signals a fragile balance sheet where a modest drop in operating profit threatens interest payments.
Below 1.0x: Indicates current profits cannot cover basic interest obligations, forcing the business to draw down cash or borrow more.
Why Solvency Matters for Long-Term Investors
In practical terms, the interest coverage ratio explained above serves a central purpose: it shows that fixed debt creates downside risk for equity owners.
When revenue falls during a recession, a company usually cannot lower its contractual interest bills without its lenders' agreement. If operating earnings shrink while financing costs remain constant, a growing share of those earnings goes to creditors first, which can leave little or nothing for shareholders.
Solvency analysis helps you look past superficial revenue growth. While popular valuation tools like the price to sales ratiotell you how the market prices top-line revenue, they tell you nothing about whether debt could force a business into financial distress. Evaluating debt coverage alongside valuation metrics is an important balance when investing in stocks.
Chart showing healthy, warning, and distressed interest coverage ratio benchmark levels
As established by the CFA Institute, solvency ratios assess a firm's capacity to satisfy ongoing debt commitments and evaluate long-term financial health. A company carrying too much fixed interest relative to its earnings power faces higher capital costs and higher default risk.
Theoretical Earnings vs. 10-Year Portfolio Reality
While an income statement may display positive operating income, real-world corporate health depends on hard cash flows that compound over time.
Accounting rules allow companies to record revenue when sales are booked, not when cash is collected. If a company with a 2.5x coverage ratio has millions tied up in uncollected customer bills, it may lack the actual cash needed to pay lenders.
Over a 10-year holding period, heavy interest service quietly drains capital that would otherwise compound for equity holders.
Consider the cumulative impact on a hypothetical company with $100 million in invested capital. The figures below assume a constant 8.0% annual return, full reinvestment of remaining profit, and no taxes, so they are illustrations rather than forecasts, and actual returns may be lower or even negative:
A sensibly financed business paying $2 million in annual interest can reinvest $8 million of a $10 million operating profit. Reinvesting that $8 million annually at an 8.0% return builds approximately $115.9 million in cumulative value over 10 years.
An indebted peer with the same $10 million operating profit but $6 million in annual interest can only reinvest $4 million each year. Over that same decade at an 8.0% return, reinvesting $4 million yields roughly $57.9 million.
In this hypothetical, the high-debt business would forgo nearly $58 million in potential value over a decade, because interest payments absorb cash that could otherwise be reinvested.
Companies running low coverage ratios may find it harder to recover quickly during economic slowdowns; even if they avoid bankruptcy, the constant drain of interest payments can restrict their ability to invest in new opportunities when competitors are expanding.
Common Pitfalls and Real-World Flaws
Relying on a single coverage snapshot can lead to misleading conclusions if you ignore real-world balance sheet mechanics.
Watch for 3 common traps when evaluating debt coverage:
EBIT is not cash: Operating income ignores working capital swings and equipment replacement costs. A capital-heavy business may spend millions maintaining machinery, leaving far less cash for debt service than EBIT suggests.
Floating rates and refinancing walls: A coverage ratio reflects historical interest expenses. If a business holds floating-rate debt or must refinance bonds at higher market interest rates, its annual interest expense can surge quickly, cutting the coverage ratio in half.
Industry business models vary: Comparing coverage across different sectors causes false alarms. Regulated utilities maintain steady, contracted cash flows, which can allow them to operate comfortably at lower coverage ratios than companies with more volatile earnings. In contrast, cyclical manufacturing companies often need a larger buffer to withstand revenue slumps.
Conclusion
This ratio provides a clear measure of balance sheet safety by showing how well operating profits protect a company against fixed debt charges. It reminds investors that revenue growth means little if debt service absorbs operating profits during an industry downturn. For individual stock pickers, tracking coverage helps filter out financially fragile businesses before trouble arrives.
However, if you follow a passive index strategy, broad diversification can reduce how much any single company's debt problems affect your portfolio, although it does not remove market-wide risk. When you are ready to select a platform for building a resilient portfolio, our Broker reviews offer an independent place to compare account fees and features.
All equity investing involves risk of capital loss, and historical financial ratios do not guarantee future business solvency, so treat accounting metrics as educational tools rather than personal investment recommendations.
FAQ
5 questions
Can a company have a negative interest coverage ratio?
Yes, the ratio turns negative when a company's operating income (EBIT) is negative, meaning it is losing money from core operations. A negative ratio is a critical warning sign because the business cannot pay any portion of its debt obligations from daily operations. It must burn through existing cash balances, issue new shares, or take on additional debt to avoid default.
What is the difference between interest coverage ratio and debt service coverage ratio (DSCR)?
While this ratio measures a company's ability to pay interest charges alone, the debt service coverage ratio (DSCR) measures the ability to pay both interest and principal payments due on debt. DSCR offers a broader view of immediate debt obligations, making it particularly popular among commercial banks and mortgage lenders evaluating loan applications.
Why is EBITDA sometimes used instead of EBIT to calculate coverage?
Some analysts substitute EBITDA (earnings before interest, taxes, depreciation, and amortization) for EBIT to view cash-level earnings before non-cash accounting charges. While EBITDA coverage often makes heavily leveraged businesses look healthier, it ignores necessary capital expenditures and equipment replacement costs, which can mask serious long-term solvency risks.
Where can individual investors find the numbers to calculate this ratio?
You can find operating income (EBIT) and interest expense directly on a public company's income statement in its annual or quarterly regulatory filings. Most major investment brokerages, stock screeners, and financial data providers also calculate the ratio automatically under balance sheet or solvency metrics.
Do long-term index fund investors need to track interest coverage ratios?
Generally, no. Passive index fund investors usually do not need to track coverage ratios for individual companies. Broad-market index funds spread money across hundreds or thousands of businesses across every economic sector. While individual companies within an index may encounter debt distress, broad diversification reduces the chance that any single corporate bankruptcy will derail a long-term portfolio, although it cannot eliminate losses that hit the whole market.
Disclaimer
This guide was written with AI assistance and reviewed by the StockEmber editorial team for accuracy. StockEmber provides independent education, not personal financial advice. Investing puts your capital at risk: the value of investments can go down as well as up, you may get back less than you invest, and past performance doesn’t guarantee future results. Some links may support our work at no additional cost to you.
The StockEmber Team is our in-house desk of independent research writers. We test brokerage platforms, read the fine print on fees and custody, and cover ETFs and long-horizon investing for people who plan to hold for decades — not days.