The CRSP US Total Market Index is a broad equity benchmark designed to track approximately 100% of the investable US stock market across mega, large, mid, small, and micro-cap companies. Maintained by the Center for Research in Security Prices, it utilizes float-adjusted market-capitalization weighting with buffer zones to minimize trading turnover. Long-term investors frequently use funds benchmarked to this index as a low-cost foundation for comprehensive domestic equity exposure.
The CRSP US Total Market Index is a comprehensive financial benchmark designed to track approximately 100% of the investable US equity market across all market capitalizations.
If you want complete exposure to American enterprise, choosing the right market benchmark forms the backbone of your portfolio strategy. Understanding how this index selects constituents, manages trading turnover, and weights its holdings helps you evaluate whether broad market indexing fits your long-term wealth building goals. In this guide, we break down its underlying mechanics, weighting structure, and core differences relative to top-heavy market alternatives.
Quick Takeaways
01The CRSP US Total Market Index captures nearly 100% of the investable US stock market, including mega, large, mid, small, and micro-cap equities.
02Built by the Center for Research in Security Prices, the index uses market-capitalization weighting alongside turnover-minimizing buffer rules.
03While holding thousands of stocks provides broad structural diversification, top mega-cap corporations still drive the majority of daily index performance.
Understanding the CRSP US Total Market Index
The CRSP US Total Market Index is a comprehensive equity benchmark created by the Center for Research in Security Prices (CRSP) at the University of Chicago Booth School of Business to measure the total return of the US stock market. Formally known as the CRSP US Total Market Index, this benchmark tracks over 3,700 individual equities, spanning roughly 100% of the investable US equity market.
Unlike narrower market indicators that restrict entry to specified market-cap tiers or financial profitability requirements, this benchmark captures every viable public company trading on major domestic exchanges. By spanning mega-cap technology leaders down to tiny micro-cap manufacturing firms, it offers buy-and-hold investors an unbiased snapshot of total US business activity.
How the Index Works: Weighting & Buffers
The CRSP US Total Market Index operates on a float-adjusted market-capitalization weighting methodology, meaning larger companies represent a proportionally higher percentage of the index value. This weighting structure ensures that a company valued at $2 trillion exerts fifty times more influence on total index movement than a company valued at $40 billion.
To prevent excessive portfolio churn and high trading costs, CRSP uses band-based rebalancing mechanisms known as "pack buffers." When a growing small-cap stock approaches the threshold of mid-cap status, these buffer zones allow the security to remain in its existing tier until it decisively crosses the boundary. The index undergoes rebalancing quarterly to update share counts and market capitalizations. Long-horizon investors typically gain exposure to this index through low-cost funds, which is why understanding what is an ETF remains essential when evaluating efficient market access.
In practice, many long-term investors find that the index's turnover-reduction rules can meaningfully reduce trading costs over time by minimizing the internal transactions that more actively rebalanced strategies tend to incur.
CRSP Total Market vs. S&P 500: Key Differences
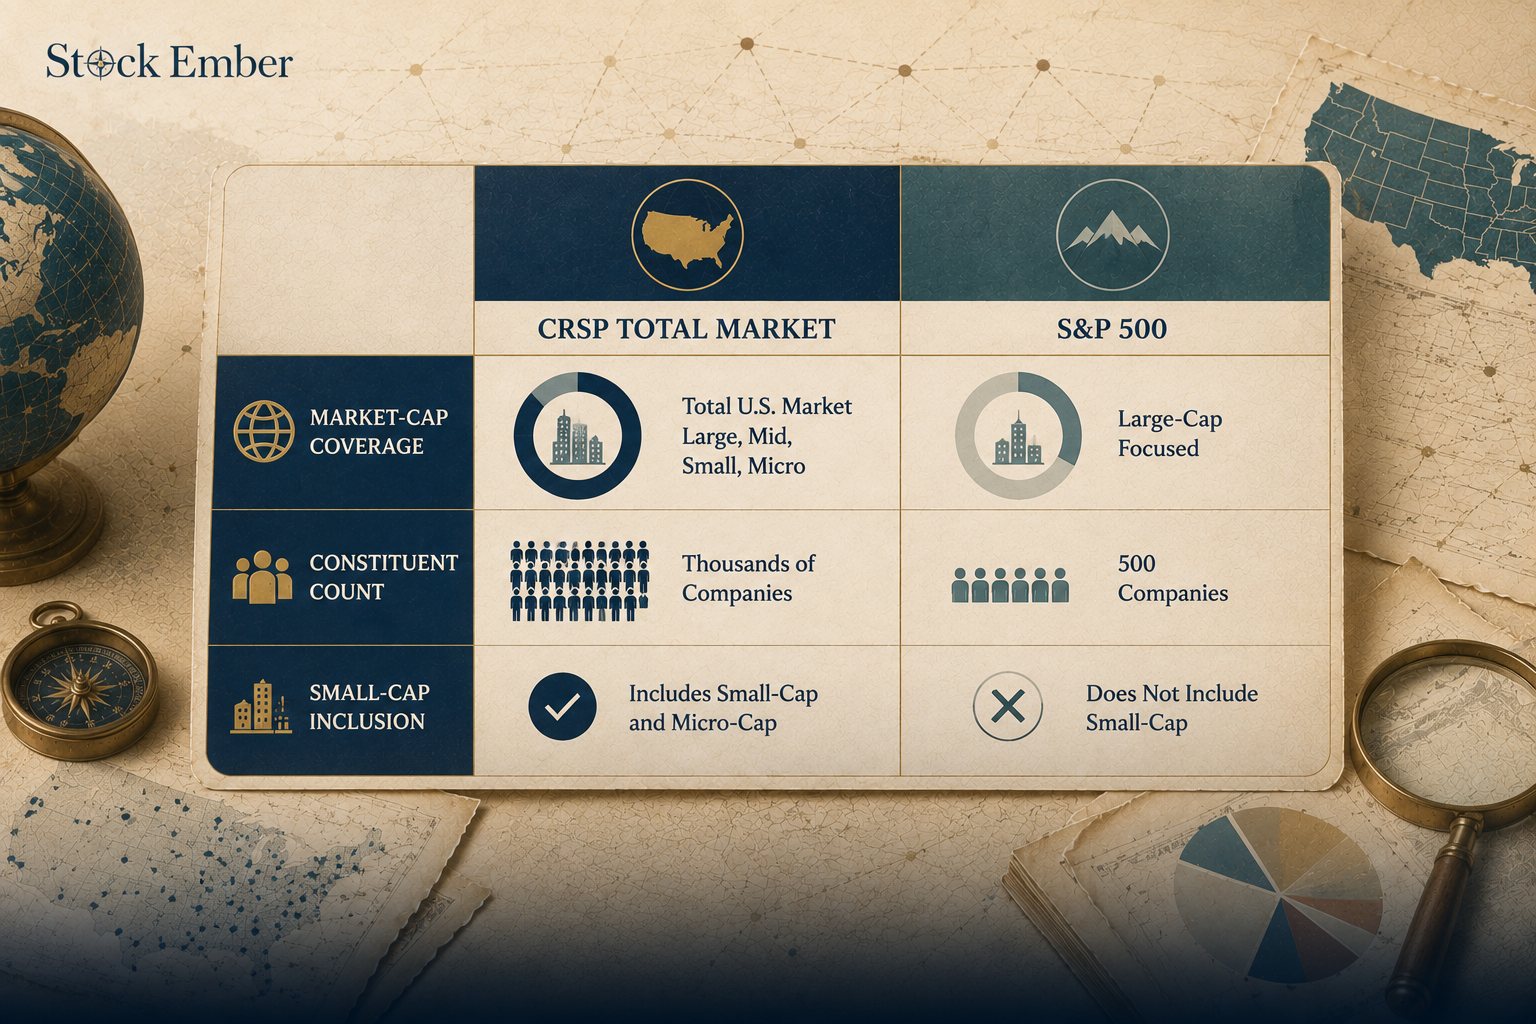
The primary difference between the CRSP US Total Market Index and the Standard & Poor's 500 (S&P 500) lies in total market coverage, constituent selection criteria, and small-cap representation. While the S&P 500 tracks approximately 500 selected large-cap US corporations representing roughly 80% of total domestic market value, the CRSP US Total Market Index holds nearly eight times as many companies to capture the remaining 20% of the investable market.
Comparison chart highlighting differences between CRSP US Total Market Index and S&P 500.
Feature
CRSP US Total Market Index
S&P 500
Market Coverage
~100% of investable US equity
~80% of US equity market value
Constituent Count
~3,700+ stocks
~500 stocks
Market-Cap Scope
Mega, Large, Mid, Small, Micro
Large-Cap only
Inclusion Criteria
Comprehensive investable universe
Committee-selected based on size & earnings profitability
Small/Micro-Cap Exposure
Full inclusion
Excluded
While the addition of thousands of smaller companies provides broad exposure, historical price movements between these two indices remain highly correlated due to the dominance of shared mega-cap holdings.
The Mega-Cap Concentration Reality
Mega-cap equity concentration dictates that despite holding thousands of small- and micro-cap stocks, the CRSP U.S. Total Market Index remains heavily influenced by its largest constituent companies. Because market-cap weighting allocates capital according to total market value, the top 10 largest holdings often account for 25% to 30% or more of the index's total weight, according to Vanguard VTI Fund Holdings (as of July 2026).
As a result, a dramatic shift in small-cap performance will typically have minimal effect on the index's overall daily return, whereas a major price movement among top technology giants can meaningfully shift total index performance. To manage this built-in US equity concentration, investors frequently pair total domestic market index funds with international benchmarks such as the FTSE All-World Index, helping balance geographic exposure within a broader global asset allocation strategy.
What to Watch: Drawdowns and Long-Term Costs
Holding a total market index exposes investors to full broad-market volatility, meaning broad diversification across thousands of equities does not prevent severe drawdowns during broad economic downturns. When the broader market declines, small-cap inclusion can occasionally increase downside volatility compared to holding large-cap stability alone.
Furthermore, over a multi-decade holding period, fund implementation costs matter tremendously. Consider a $100,000 portfolio held over a 10-year period assuming a hypothetical 7% gross annual return:
At a low expense ratio of 0.03%, your total fee drag remains under $600 over a decade, allowing your portfolio to grow to roughly $196,000.
At a higher fee of 0.50%, cumulative fee drag eats away more than $9,000 in direct fees and lost compounding return over that same 10-year horizon.
In practice, many long-term investors find that minimizing fund expense ratios and avoiding unnecessary turnover are two of the few variables completely within an investor's control to maximize net compounding returns.
Conclusion
The CRSP US Total Market Index offers long-horizon investors an efficient, low-cost method to capture the full economic output of the US corporate sector. By combining float-adjusted market-cap weighting with smart buffer rules, the index balances broad diversification with low operational turnover. While mega-cap stocks continue to steer overall daily movements, holding thousands of smaller enterprises may help position investors to participate in the growth of future market leaders that emerge over a multi-decade horizon. When you are ready to evaluate specific investment vehicles that track this benchmark, our ETF reviews are a logical next step to examine fee structures, tracking error, and liquidity.
FAQ
5 questions
What is the CRSP US Total Market Index?
The CRSP US Total Market Index is a comprehensive financial benchmark that measures the performance of virtually the entire investable US equity universe. Created by the Center for Research in Security Prices at the University of Chicago Booth School of Business, it spans mega, large, mid, small, and micro-cap stocks to deliver an unbiased picture of total US enterprise.
How many stocks are in the CRSP US Total Market Index?
The index holds approximately 3,700+ individual US stocks. Unlike narrower stock market indices that set strict profitability requirements or limit constituent counts to a specific threshold, the CRSP US Total Market Index captures nearly 100% of the publicly traded, investable US equity market.
What is the difference between the S&P 500 and the CRSP US Total Market Index?
While the S&P 500 tracks roughly 500 large-cap US corporations accounting for ~80% of total market value, the CRSP US Total Market Index captures ~100% of the market across all capitalization sizes. The CRSP index includes thousands of small and micro-cap companies that are completely excluded from the committee-selected S&P 500.
Is the CRSP US Total Market Index market-cap weighted?
Yes, the index employs float-adjusted market-capitalization weighting. This means larger corporations make up a higher percentage of total index weight than smaller companies. To manage turnover, CRSP incorporates "pack buffers" to keep securities from constantly shifting between size categories due to temporary price changes.
How often is the CRSP US Total Market Index rebalanced?
The index undergoes rebalancing on a quarterly schedule. During these reviews, share counts, float adjustments, and market-capitalization boundaries are updated to ensure accurate market representation without creating unnecessary trading costs or capital gains turnover for fund holders.
Disclaimer
This guide was written with AI assistance and reviewed by the StockEmber editorial team for accuracy. StockEmber provides independent education, not personal financial advice. Some links may support our work at no additional cost to you.
The StockEmber Team is our in-house desk of independent research writers. We test brokerage platforms, read the fine print on fees and custody, and cover ETFs and long-horizon investing for people who plan to hold for decades — not days.