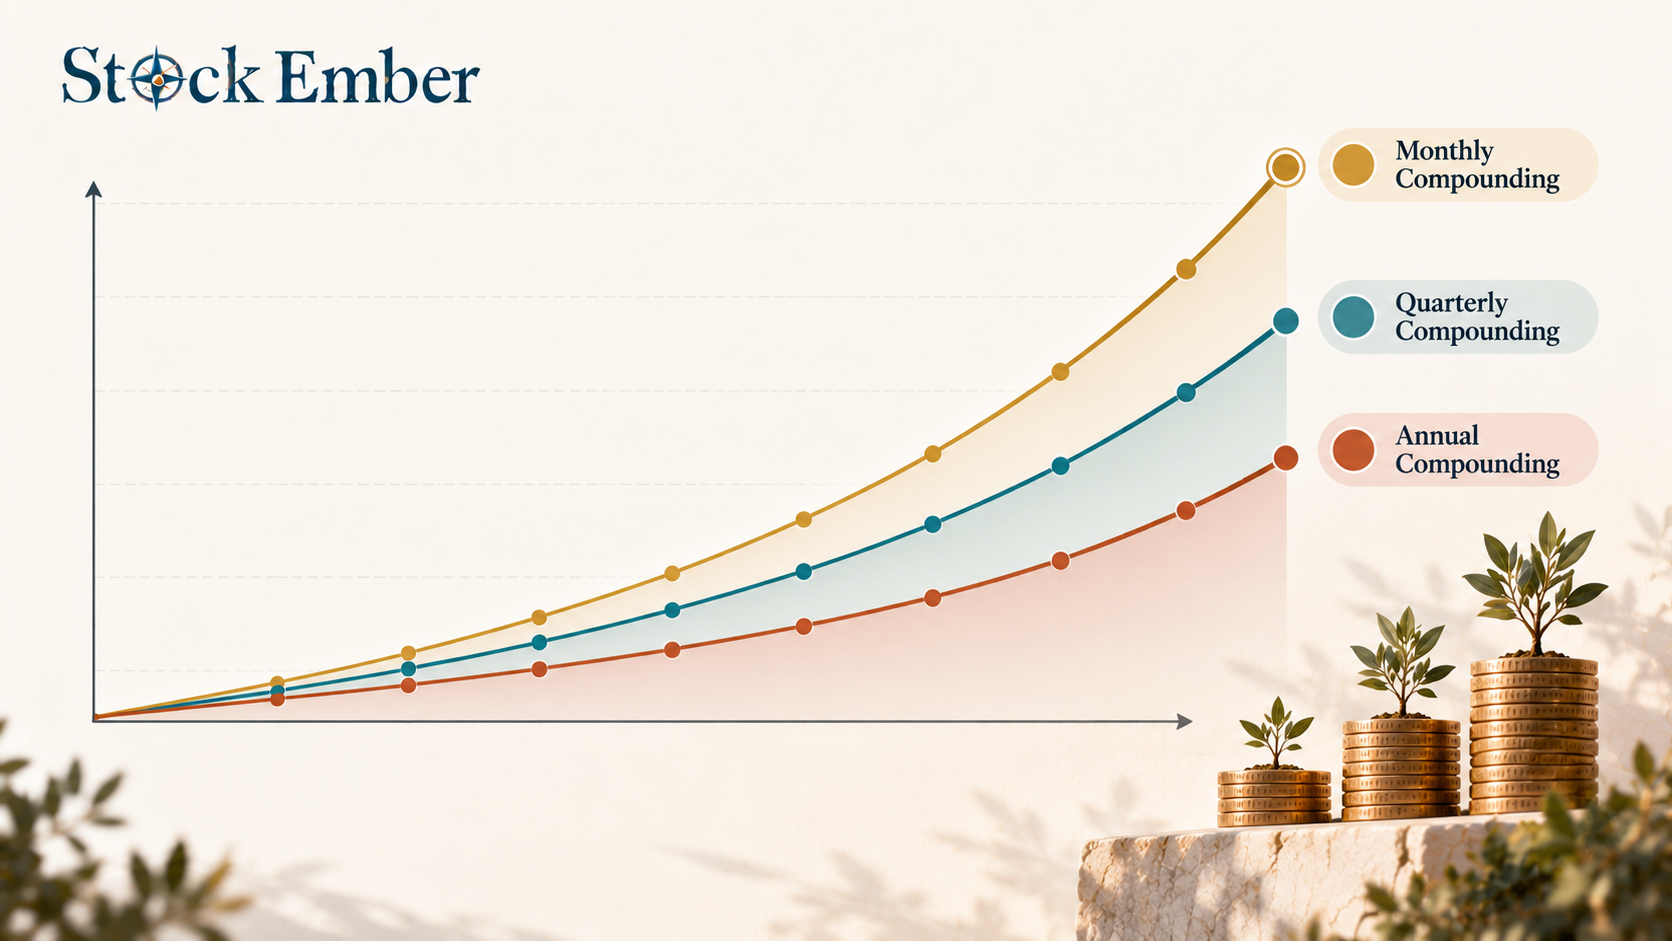
A compound interest formula example calculates how a starting investment compounds over time by adding earned interest back into the principal balance. Using the standard formula A = P * (1 + r/n)^(n*t), it demonstrates the exponential growth created when returns generate their own subsequent returns. This mathematical model helps investors project long-term wealth accumulation across varying compounding intervals and time horizons.
A compound interest formula example shows how an initial sum grows when interest earns interest on itself over repeated cycles.
Seeing compounding on paper is helpful, but calculating how your savings expand over a decade makes the concept practical. Many savers wonder how small shifts in rates or schedules alter their ending balance. This guide walks through the exact formula, solves a step-by-step example with round numbers, and shows how real-world friction shapes long-term returns.
Quick Takeaways
01The compound interest formula calculates how an initial deposit grows when earned interest is repeatedly reinvested.
02Compounding frequency dictates how often interest is calculated, with monthly compounding yielding slightly more than annual compounding.
03The Rule of 72 provides a quick mental estimate of how many years your money takes to double at a given rate.
04Investment fees, inflation, and taxes create ongoing friction that dampens theoretical mathematical returns over time.
What Is the Compound Interest Formula?
The compound interest formula calculates the future value of an investment using principal, interest rate, compounding frequency, and time.
The standard formula is written as:
A = P * (1 + r/n)^(n*t)
In this equation, each variable serves a specific purpose:
A is the final accrued amount (principal plus accumulated interest).
P is the principal (the initial deposit or invested cash).
r is the annual interest rate (in decimal form, such as 0.06 for 6%).
n is the compounding frequency (how many times interest is calculated per year).
t is time (the number of years the money stays invested).
When savers ask what is a compound interest formula example, they want to see how math translates into actual account balances. The compound interest formula example centers on calculating how reinvested earnings multiply over time. A compound interest formula example explained clearly reveals how consistent reinvestment builds capital.
Unlike simple interest, which pays returns only on the original deposit, the foundational mechanics of compound interest show how gains generate their own future earnings over time.
Step-by-Step Compound Interest Formula Example
To calculate compound interest step by step, insert your figures into each variable and solve the equation using standard mathematical order of operations.
Consider this concrete scenario:
Principal (P) = $10,000
Annual interest rate (r) = 6% (0.06 as a decimal)
Compounding frequency (n) = 12 (monthly)
Time (t) = 10 years
Here is the step-by-step solution:
Find the periodic rate (r / n): Divide 0.06 by 12 to get 0.005 (0.5% per month).
Add one (1 + r / n): Add 1 to 0.005 to get 1.005.
Calculate total periods (n * t): Multiply 12 periods by 10 years to get 120 cycles.
Apply exponent (1.005^120): Multiply 1.005 by itself 120 times, which equals roughly 1.819397.
Multiply by principal (P): Multiply $10,000 by 1.819397 to reach a final balance of $18,193.97.
Subtracting your starting $10,000 deposit leaves $8,193.97 in total interest earned. Because interest compounds monthly, the effective annual yield is about 6.17%, slightly higher than the stated 6% rate.
In practice, many long-term savers use the Rule of 72 for a quick estimate: divide 72 by the annual rate to see roughly how long it takes money to double. At a 6% return, that gives about 12 years (72 ÷ 6). The exact figure is closer to 11.9 years with annual compounding, so the shortcut is a handy estimate, not a replacement for the full formula.
How Compounding Frequency Changes Your Return
Compounding frequency determines how often an institution calculates interest and adds it back to your balance. The Consumer Financial Protection Bureau (CFPB) describes compound interest as earning interest on both your original savings and the interest you have already earned.
The more often interest compounds, the faster capital builds, because each cycle adds slightly more money to generate the next payment. However, frequent intervals produce diminishing gains.
The table below shows how different frequencies affect a $10,000 deposit earning 6% interest over ten years:
Compounding Frequency
Total Periods
Final Balance (A)
Total Interest Earned
Annually (n = 1)
10
$17,908.48
$7,908.48
Quarterly (n = 4)
40
$18,140.18
$8,140.18
Monthly (n = 12)
120
$18,193.97
$8,193.97
Daily (n = 365)
3650
$18,220.29
$8,220.29
Daily compounding assumes a 365-day year. Some institutions use a 360-day year, which changes the daily figure slightly.
Moving from annual to monthly compounding adds $285.49 in interest over a decade, while shifting from monthly to daily adds only $26.32 more.
Chart showing account balances across different compounding frequencies over a ten-year horizon
When managing cash reserves or fixed-income assets, compounding frequency shapes overall income schedules. For example, investors focused on fixed income often use strategies like building a bond ladder to capture regular interest payments across staggered maturity dates.
The 10-Year Cost of Friction: What the Math Ignores
Standard compounding formulas assume a frictionless environment, but real-world investments face ongoing drag from fund fees, trading spreads, and taxes.
Over a ten-year horizon, small annual fees quietly strip thousands of dollars from your compound growth curve. The SEC fee bulletin makes the same point: small-looking fees can have a major impact over time.
Imagine you invest $100,000 into a diversified portfolio earning a hypothetical gross annual return of 7%. This is an illustration, not a prediction, since actual returns vary and are never guaranteed. With zero fees, your balance grows to roughly $196,715 after ten years.
Now suppose your portfolio loses 1.5% each year to expense ratios (the annual operating expenses a fund deducts from its assets), transaction spreads, and tax friction. For simplicity, this example subtracts the full 1.5% from the annual return, so your net return drops to 5.5%. Over ten years, your portfolio reaches only $170,814.
That 1.5% friction gap removes roughly $25,900 from your wealth. The cost is not just the fees paid each year; it is also the lost compound earnings that those missing dollars would have generated over time.
This cost drag is why many long-term investors favor passive investing, where low fund expense ratios keep friction to a minimum and protect the compound curve.
Common Compounding Misconceptions to Avoid
The most frequent compounding errors stem from assuming that real investments grow in a straight, uninterrupted line.
First, do not expect market returns to match smooth formula curves. While bank deposits pay fixed rates, stock market investments fluctuate through bull and bear markets. Earning an average return over ten years involves market declines and recoveries, which creates sequence risk (the danger that market declines occur early in your timeline) if you need cash during a downturn.
Second, avoid pulling money out early. Compounding produces its greatest gains in the final years of an investment horizon. Withdrawing interest or selling shares during market drops resets your growth engine.
Third, remember to account for inflation. If your portfolio earns 5% while inflation runs at 3%, your real purchasing power expands at only 2% per year. Building long-term wealth requires aiming for returns that outpace the rising cost of living.
Conclusion
A compound interest formula example proves that patience and time turn modest initial deposits into meaningful long-term wealth. By understanding the core variables, calculating the effect of compounding frequency, and eliminating unnecessary fees, you give your money the best opportunity to grow.
When you are ready to evaluate low-cost funds for your long-term plan, our ETF reviews are the place to start. Investing always carries risk of loss and past performance does not guarantee future results, so use this guide as an educational foundation for your personal financial research.
FAQ
5 questions
Does the compound interest formula apply directly to stocks and ETFs?
While the formula models predictable fixed rates, stocks and ETFs generate compound returns through fluctuating capital appreciation and reinvested dividends rather than a guaranteed interest percentage. Over long horizons, the mathematical snowball effect works similarly, but real-world market returns experience volatility and drawdowns rather than a smooth, straight-line growth path.
What is the simplest mental shortcut to calculate compounding growth?
The Rule of 72 is the most practical mental shortcut for estimating investment growth without a calculator. By dividing 72 by your expected annual rate of return, you find the approximate number of years needed to double your initial capital. For instance, an investment earning an 8% annual return takes roughly nine years to double.
Why does daily compounding produce only slightly more money than monthly compounding?
Compounding benefits from diminishing returns as calculation frequencies increase. While moving from annual to monthly compounding creates a noticeable jump because money is reinvested twelve times earlier, shifting from monthly to daily compounding only subdivides already-small increments. The tiny difference rarely justifies choosing one financial account over another solely based on daily calculation cycles.
What is the main difference between simple interest and compound interest?
Simple interest calculates returns strictly on your original principal, meaning your annual dollar payout remains completely identical every year. Compound interest calculates returns on both the starting principal and all accumulated earnings from previous periods. Over long time horizons, this reinvestment cycle creates an exponential curve where earnings rapidly overtake the initial deposit.
Can inflation completely wipe out the benefits of compound interest?
High inflation can significantly erode the purchasing power generated by compounding if your nominal growth rate falls below the annual inflation rate. To build real long-term wealth, an investment portfolio must achieve a net rate of return that exceeds inflation, taxes, and ongoing management fees, ensuring that your future capital buys more goods and services than today.
Disclaimer
This guide was written with AI assistance and reviewed by the StockEmber editorial team for accuracy. StockEmber provides independent education, not personal financial advice. Investing puts your capital at risk: the value of investments can go down as well as up, you may get back less than you invest, and past performance doesn’t guarantee future results. Some links may support our work at no additional cost to you.
The StockEmber Team is our in-house desk of independent research writers. We test brokerage platforms, read the fine print on fees and custody, and cover ETFs and long-horizon investing for people who plan to hold for decades — not days.