Compound interest is the mathematical process where an initial investment earns returns, and those accumulated returns subsequently earn returns of their own. Unlike simple interest, which only pays out on the original principal, compounding creates an accelerating, non-linear growth curve over time. In equity markets, this engine functions as compound returns driven by asset appreciation and dividend reinvestment.
Compound interest is the mathematical process where an initial investment earns returns, and those accumulated returns subsequently earn returns of their own over time. It represents a fundamental shift from static growth to accelerating growth, acting as the primary mathematical engine behind long-term wealth accumulation.
For many long-horizon investors, the true power of compounding is difficult to conceptualize initially because the human brain naturally favors linear progression over exponential curves. Understanding how this mechanic shifts from standard bank accounts to fluctuating equity markets—and identifying the hidden frictions that can compound against you is essential for building a resilient, decade-scaled portfolio.
Quick Takeaways
01Compound interest is the mathematical process where an initial investment earns returns, and those returns subsequently earn returns of their own over time.
02Unlike simple interest, which only pays out on the original principal, compounding creates an accelerating, non-linear growth curve.
03In volatile equity markets, compounding transitions into "compound returns" driven heavily by asset appreciation and dividend reinvestment plans (DRIPs).
04The same mathematical force works in reverse; internal investment fees and inflation compound negatively against your portfolio over a decade.
What Is Compound Interest?
At its core, compound interest is simply "interest earned on interest." When you deploy capital into a financial vehicle that offers compounding, you receive payouts not just on your original deposit (the principal), but also on the previous interest payments that have been added to your balance.
To visualize this process, long-term investors frequently use the classic snowball analogy. Imagine rolling a small ball of snow down a snow-covered hill. As it moves, the surface area of the ball expands, allowing it to gather more snow with every single revolution.
The bigger the snowball becomes, the more snow it picks up on its next turn. In the financial world, your principal is that initial handful of snow, and the rolling distance down the hill represents time.
How Does Compound Interest Work?
To understand how does compound interest work, it helps to contrast its mathematical engine against simple interest. Simple interest operates on a fixed, linear trajectory: if you place $10,000 in an account that pays 5% simple interest annually, you will receive exactly $500 every single year. After 20 years, your total return is a predictable, flat $10,000.
Compound interest rejects this linear path. In a compounding environment, the first year looks identical—you earn 5% on your $10,000 principal, leaving you with $10,500. However, in the second year, the 5% calculation is applied to your new total of $10,500, yielding $525 instead of $500. By year three, you are earning 5% on $11,025.
The frequency at which this calculation occurs alters the momentum of the curve. Financial systems compound interest on varied schedules:
Annually: The calculation occurs once per year.
Monthly: Returns are computed and credited 12 times a year, meaning each month's growth builds on the month before it.
Daily: The most aggressive frequency, where tiny fractions of growth are added 365 times a year, maximizing the speed at which the curve accelerates.
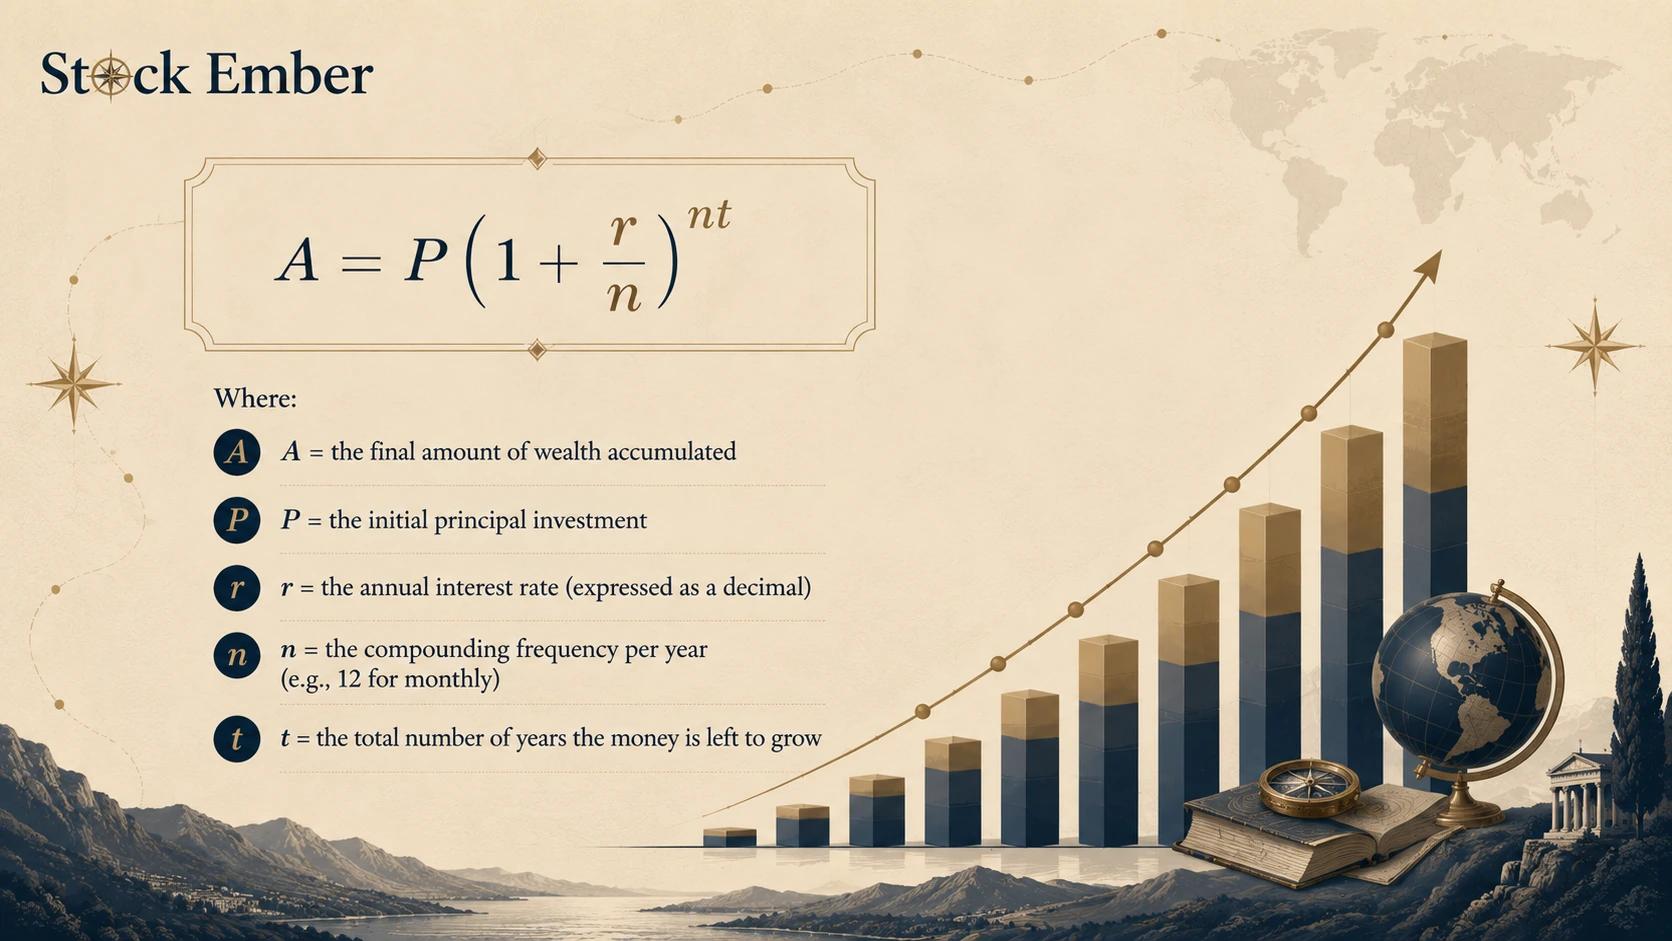
To calculate this precisely across any horizon or frequency, economists rely on the standard compounding formula — you can verify any scenario with the official compound interest calculator from the U.S. Securities and Exchange Commission (SEC) at Investor.gov.
Compound interest formula with definitions of principal, rate, frequency, and time
Simple Interest vs. Compound Interest: The Mathematical Fork
The divergence between a linear timeline and an exponential curve starts slowly, but it widens dramatically over multi-decade horizons.
The following data table illustrates the growth of a static $10,000 principal at a 5% annual rate, comparing a simple interest structure against an annually compounded structure over 20 years:
Horizon
Simple Interest Total ($)
Compound Interest Total ($)
The Compounding Premium ($)
Year 1
10,500
10,500
0
Year 5
12,500
12,763
263
Year10
15,000
16,289
1,289
Year 20
20,000
26,533
6,533
During the first five years, the difference appears modest. This slow start is why many novice investors lose patience. However, by Year 20, the compounding engine has generated an extra $6,533 entirely out of its own accumulated momentum.
From Bank Accounts to the Stock Market: Compound Returns
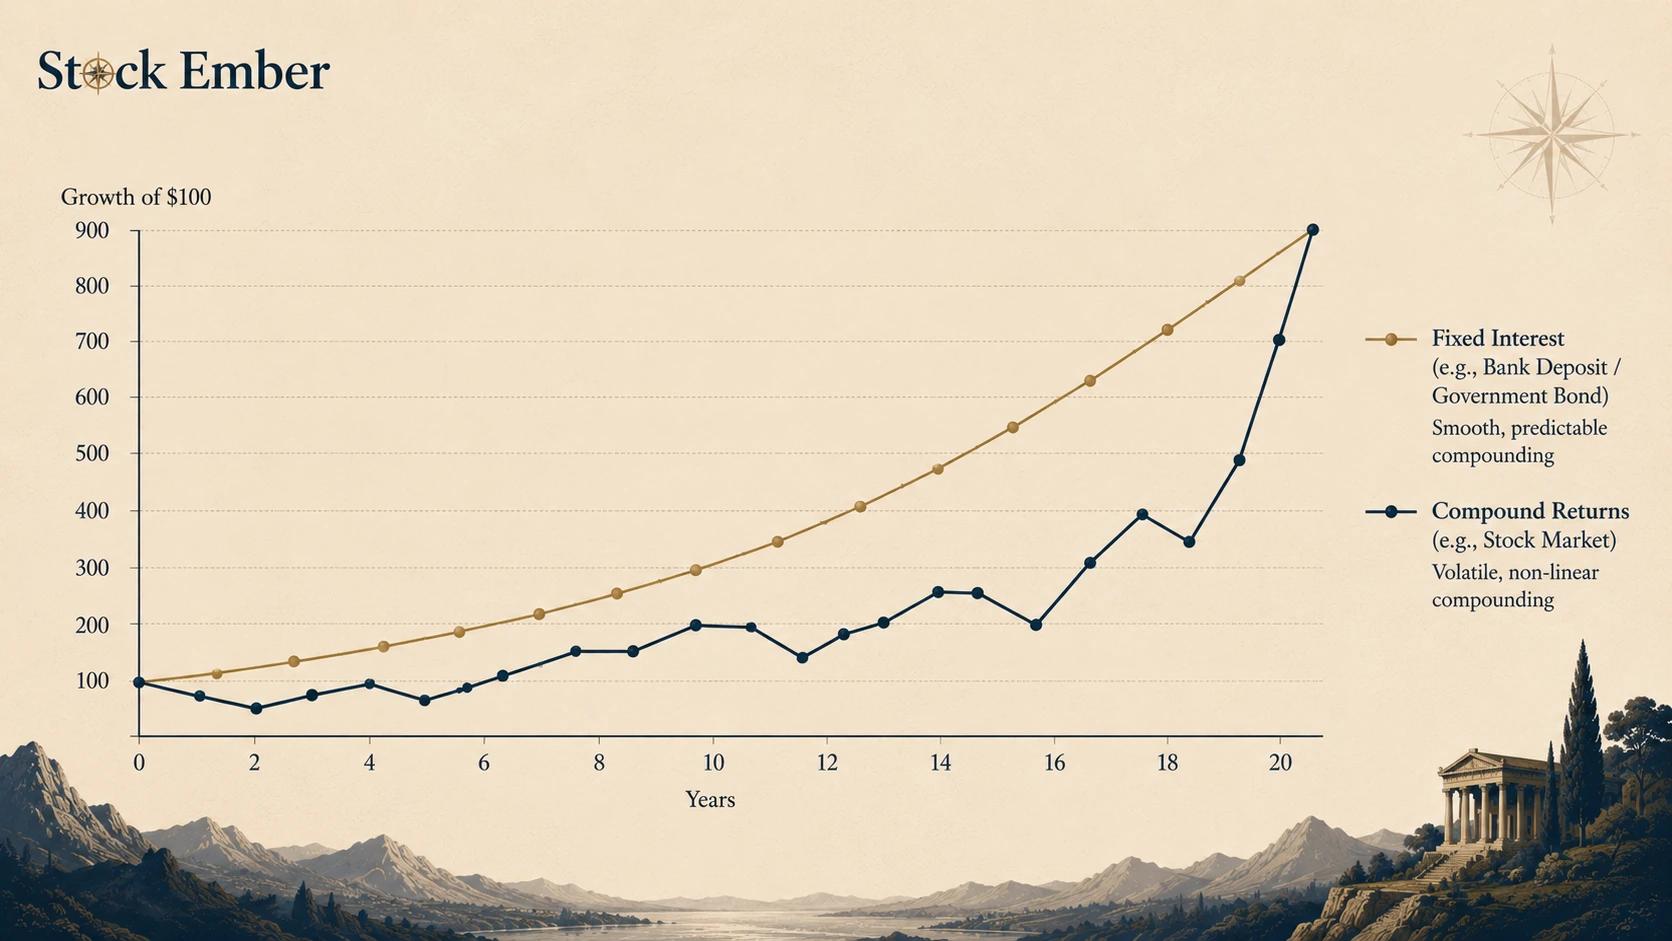
While bank savings accounts and government bonds offer a smooth, predictable compounding rate, the stock market operates differently. Equities do not yield a fixed annual percentage. Instead, long-horizon equity investors experience compound returns, where growth moves along a volatile, non-linear path.
In a fluctuating stock market, compounding does not occur in a neat, straight line. A portfolio might grow by 12% in Year 1, drop by 5% in Year 2, and gain 8% in Year 3. When the market falls, it drops off a larger, compounded base; when it recovers, it builds from a lower, compressed baseline.
Bridging the concept of compounding to equity investing requires understanding how do dividends work. When a company distributes profits to shareholders, that cash leaves the company's balance sheet. If you take that cash and spend it, your compounding engine stalls. However, if you channel those payouts back into buying more shares — either manually or automatically through a dividend reinvestment plan (DRIP) — each new share generates its own future dividends, keeping the compounding cycle in motion.
Line chart comparing smooth fixed-interest compounding with volatile stock market compound returns over 20 years
The 10-Year Friction: What Compounds Against You
The exact same exponential math that makes compound interest build wealth can also systematically dismantle it. For buy-and-hold investors, compounding friction is the ultimate hidden risk.
When you buy a fund or use a management platform, the fees are often presented as a small, annual percentage—such as a 1% expense ratio. While 1% looks minor in isolation, that fee is extracted every single year from your entire accumulated balance.
Consider the 10-year impact: a portfolio compounding at 5% net of a 1% annual fee ends roughly 9–10% smaller after a decade than the same portfolio without the fee. That is capital permanently removed from your ecosystem — capital that can never earn interest again.
Similarly, inflation acts as a negative compounding force on uninvested cash. If inflation averages a steady rate over a decade, the purchasing power of capital held under a mattress or in a zero-interest account shrinks exponentially, making it harder to catch up in the future.
The greatest obstacle to successful long-term compounding is behavioral bias, specifically a phenomenon known as hyperbolic discounting. Human beings are evolutionarily wired to value immediate, smaller rewards over massive, delayed payouts. We naturally prefer gratification today over an abstract, exponential reward 20 years down the line.
Because the first decade of a compounding curve looks flat and uninspiring, investors frequently abandon their strategies, change funds, or stop contributing entirely. Overcoming this cognitive trap requires strict discipline and a long-horizon perspective. Historically, the steepest part of a compounding curve tends to appear in the later years of the timeline, which is why patience matters — though actual market returns will always depend on conditions along the way.
Conclusion
The mathematics of compound interest is consistent, but in real markets, harnessing compound interest depends on time, discipline, and structural efficiency — returns are never guaranteed. Real wealth accumulation is achieved by maximizing time, maintaining consistency, and minimizing the hidden frictions that quietly erode your base capital.
When you're ready to select an efficient environment to build your long-term portfolio and keep compounding friction low, reading our curated exchange-traded fund (ETF) reviews is your ideal next step.
FAQ
4 questions
How does payout frequency affect the speed of compound growth?
More frequent compounding intervals (monthly or daily versus annually) speed up investment growth. Higher frequency adds earned returns back into the principal balance sooner, generating interest on accumulated gains faster over long periods.
What is the Rule of 72 and how is it used to estimate compounding time?
The Rule of 72 is a mental math shortcut used to estimate how long an investment takes to double. Divide 72 by your expected annual interest rate; for instance, a 7% return doubles your money in roughly 10.3 years ($72 / 7 approximately 10.3$).
Why is compound interest often called exponential growth over long horizons?
Compound interest creates exponential growth because the yield in each period is calculated on an expanding total base (principal plus prior growth), resulting in gains that accelerate over multi-decade holding windows.
How do annual fees reduce the compounding power of investment returns?
Annual fees continually shave off a percentage of your total asset balance. This removes capital early, preventing those deducted funds from compounding and significantly diminishing total long-term portfolio growth.
Disclaimer
This guide was written with AI assistance and reviewed by the StockEmber editorial team for accuracy. StockEmber provides independent education, not personal financial advice. Some links may support our work at no additional cost to you.
The StockEmber Team is our in-house desk of independent research writers. We test brokerage platforms, read the fine print on fees and custody, and cover ETFs and long-horizon investing for people who plan to hold for decades — not days.