A good Sharpe ratio is generally a score of 1.0 or higher, indicating that an investment generates sufficient excess return relative to its price volatility. A score of 2.0 or above is considered very good, while broad stock market indices historically average around 0.4 to 0.5 over multi-decade holding periods.
In other words, the Sharpe ratio shows whether the extra return a portfolio earned was worth the risk it took to earn it.
When comparing two investments, a higher total return does not automatically make one portfolio better than another if it comes with extreme price swings. Evaluating risk-adjusted returns helps you measure how efficiently a strategy generates profit relative to its price fluctuations.
This guide explains what constitutes a good ratio, how to calculate it, and how to use it when building a long-term portfolio.
Quick Takeaways
01A Sharpe ratio score of 1.0 or higher is typically considered good, while a score of 2.0 or above is very good.
02Broad stock market indices like the S&P 500 historically average a Sharpe ratio around 0.4 to 0.5 over multi-decade holding periods.
03The calculation measures excess return above a benchmark risk-free rate divided by the portfolio's standard deviation.
04Standard deviation treats both upside jumps and downside drops as risk, which can unfairly penalize high-performing equity portfolios.
What Is a Good Sharpe Ratio?
A good Sharpe ratio score tells you how much excess return an investment earns for every unit of volatility it experiences. In general benchmark terms:
Below 1.0: Sub-optimal. The investment is not generating enough excess return relative to its price fluctuations.
1.0 to 1.99: Good. The portfolio earns acceptable returns for the level of volatility involved.
2.0 to 2.99: Very Good. The strategy delivers strong returns while keeping price swings under control.
3.0 or higher: Exceptional. The portfolio achieves outstanding returns relative to its risk, though scores this high are rare over multi-year periods.
To understand the good Sharpe ratio definition in practical terms, you must evaluate score tiers against specific asset classes. While a score above 1.0 is a common benchmark for hedge funds or active trading strategies, broad equity markets rarely maintain a score that high over long horizons.
Put simply, the good Sharpe ratio meaning comes down to portfolio efficiency rather than raw profits. A fund with an 8% return and low price swings can be more efficient than a fund with a 12% return that experiences severe price crashes.
When a good Sharpe ratio is explained simply to everyday investors, it reveals whether high gains were earned through skilled asset management or merely by taking excessive market risks.
How the Sharpe Ratio Works: Formula and Core Inputs
Calculating the Sharpe ratio requires three financial inputs: portfolio return, the risk-free interest rate, and portfolio volatility.
Sharpe Ratio = (Portfolio Return − Risk-Free Rate) / Standard Deviation
Portfolio Return: The overall percentage gain or loss generated by the portfolio over a specific timeframe.
Risk-Free Rate: The yield on a zero-default government security, such as short-term US Treasury bills.
Standard Deviation: A statistical measure of how widely portfolio returns fluctuate around their average over time.
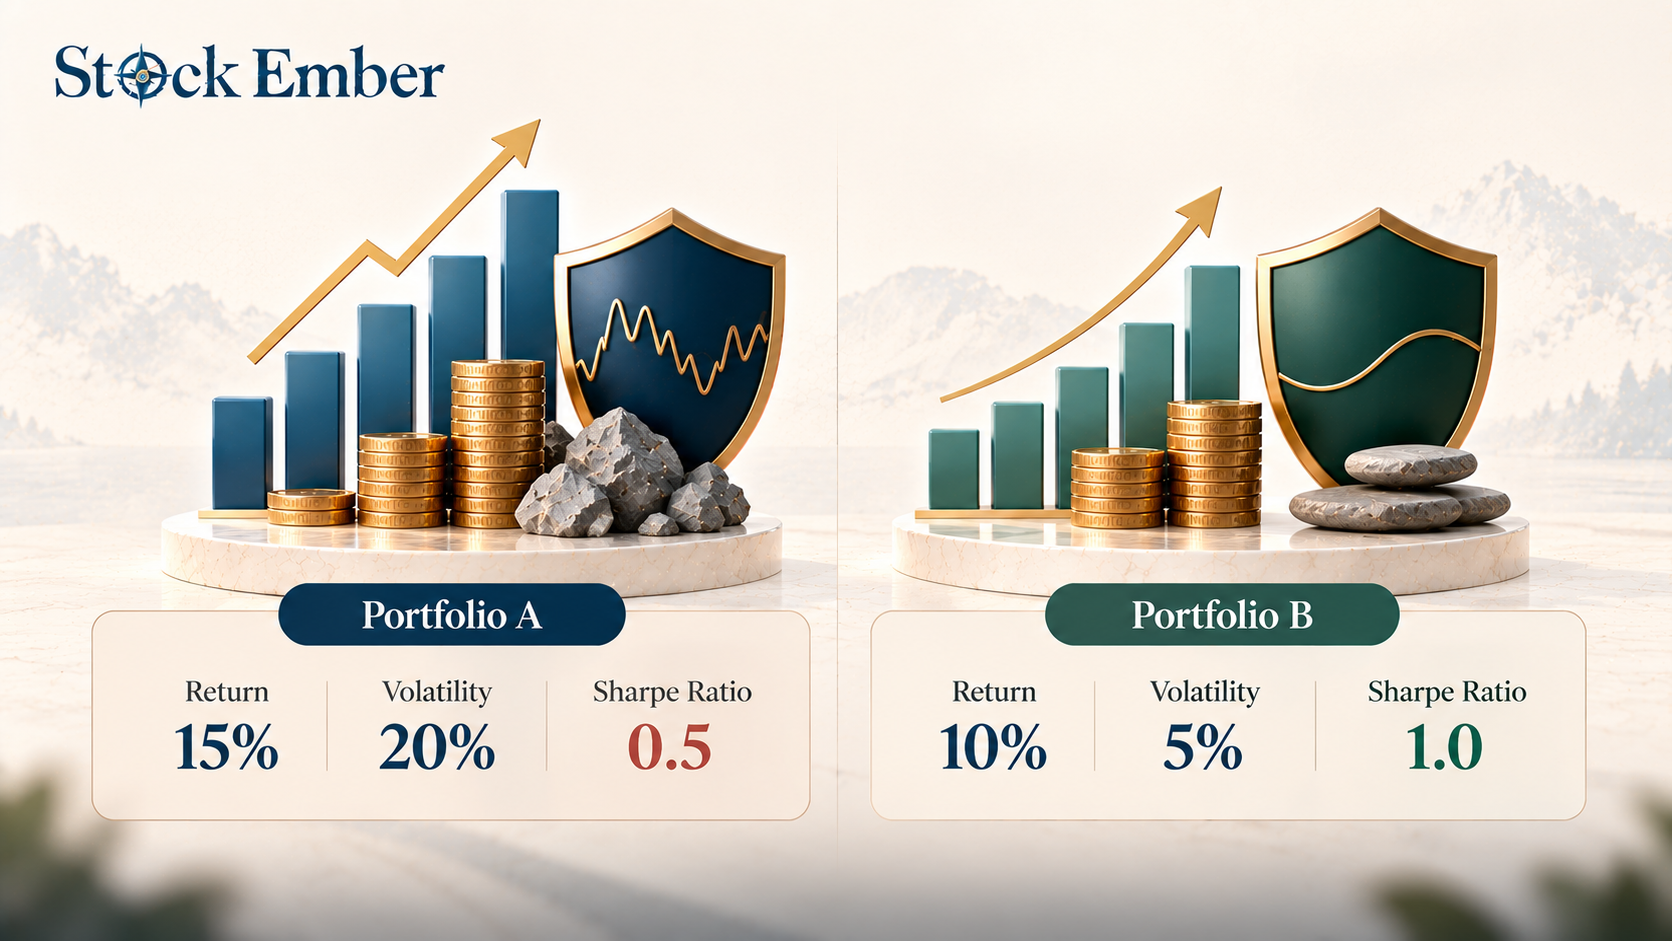
Consider two hypothetical portfolios evaluated during a period where short-term Treasury bills yield 5%:
Portfolio A: Earns a 15% return with a standard deviation of 20%. Its calculation is (15% − 5%) / 20% = 0.50.
Portfolio B: Earns a 10% return with a standard deviation of 5%. Its calculation is (10% − 5%) / 5% = 1.00.
Although Portfolio A earned a higher raw return, Portfolio B achieved a higher Sharpe ratio because it produced its gains with far less volatility.
Diagram comparing two investment portfolios to demonstrate Sharpe ratio calculations.
In practice, many long-term investors find that using short-term 3-month Treasury bill yields as the benchmark risk-free rate provides a clear baseline for evaluating equity market excess returns.
Why Sharpe Ratios Vary Across Asset Classes and Time Horizons
Expecting every investment to achieve a Sharpe ratio above 1.0 can lead to unrealistic assumptions. Over multi-decade periods, broad equity market indices like the S&P 500 have historically delivered a Sharpe ratio of roughly 0.4 to 0.5, based on annual return data compiled by NYU Stern professor Aswath Damodaran.
The same dataset also tracks 10-year Treasury bonds and Baa corporate bonds, which underpin the bond and 60/40 estimates in the table below. The 60/40 figure assumes 60% S&P 500 and 40% Treasury bonds.
Your investment time horizon heavily influences this score. Short measurement periods, such as a 1-year bull market, can temporarily inflate a risky asset's Sharpe ratio to 2.0 or higher. However, evaluating performance over a 10-year timeline incorporates full market cycles, including downturns that pull ratios back down toward historical averages.
Investment Asset Class
Typical Long-Term Sharpe Ratio
Primary Driver
Broad Stock Index (S&P 500)
0.4 to 0.5
High long-term return with equity volatility
Balanced Portfolio (60/40)
0.4 to 0.6
Lower return paired with bond stability
Investment-Grade Corporate Bonds
0.4 to 0.6
Lower return paired with interest rate risk
Over long periods, these asset classes land in a surprisingly similar range. The bigger differences show up in how they get there: stocks deliver higher returns with larger swings, while bonds and balanced portfolios trade some return for a smoother ride.
Limitations of the Sharpe Ratio for Long-Term Investors
While the Sharpe ratio is a useful screening tool, long-term investors should keep its structural limitations in mind:
Penalty on Upside Volatility: Standard deviation treats all price movements identically. A stock that surges upward by 30% in a single month increases portfolio standard deviation, which can pull the portfolio's calculated Sharpe ratio down despite the positive gain.
Sensitivity to Interest Rate Shifts: When market interest rates rise, the risk-free rate subtraction increases. If Treasury bill yields jump from 0% to 5%, an equity fund's calculated excess return drops by 5 percentage points even if its underlying assets perform well.
Ignoring Extreme Tail Risks: The formula assumes that returns follow a normal distribution. It does not measure infrequent, severe market shocks or deep portfolio drawdowns.
How Passive Investors Use Risk-Adjusted Return Metrics
For buy-and-hold investors who focus on passive investing, risk-adjusted metrics offer perspective rather than daily trading signals. You do not need to constantly calculate mathematical ratios for every index fund in your account.
Instead, understanding the broad Sharpe ratio concept helps you design an asset allocation that fits your risk tolerance. Pairing growth equities with stable fixed-income assets can improve your overall risk-adjusted profile, allowing you to stay invested through market fluctuations without panic selling.
Conclusion
So, what is a good Sharpe ratio? A score of 1.0 or higher indicates that a portfolio generates efficient returns relative to its price volatility. However, context matters: while short-term trading strategies target scores above 1.0, broad stock market indices historically average around 0.4 to 0.5 over long holding periods.
Keep in mind that historical risk-adjusted scores do not guarantee future portfolio stability. Standard deviation penalizes upside price growth, and changing interest rate environments can alter calculated ratios without changing an asset's underlying performance. Evaluating risk-adjusted metrics alongside total return and maximum drawdown (the largest peak-to-trough drop in a portfolio's value) provides a complete picture of portfolio health.
When you are ready to compare low-cost funds to build a balanced portfolio, our ETF reviews offer a clear place to start.
FAQ
5 questions
What is a good Sharpe ratio score?
A Sharpe ratio score of 1.0 or higher is generally considered good because it shows that a portfolio earns acceptable excess return for the level of risk taken. Scores between 2.0 and 2.99 are considered very good, while scores of 3.0 or higher are exceptional over long horizons.
What is the average Sharpe ratio of the S&P 500?
Over multi-decade holding periods, the S&P 500 has historically averaged a Sharpe ratio between 0.4 and 0.5, based on annual return data since 1928 compiled by NYU Stern professor Aswath Damodaran. While short bull markets can drive the ratio above 1.0 temporarily, long-term equity market volatility brings the multi-decade average closer to 0.5.
Is a higher or lower Sharpe ratio better?
A higher Sharpe ratio is generally better because it indicates that an investment delivers more excess return for every unit of price risk taken. However, compare scores only across the same time period and asset class, since upside volatility and interest rate changes can distort the ratio.
Can a Sharpe ratio be negative?
Yes. A negative Sharpe ratio occurs when an investment's total return is less than the risk-free interest rate (such as short-term US Treasury bills). It indicates that holding zero-risk government bonds would have yielded a higher return than taking on portfolio risk.
What is the difference between the Sharpe ratio and the Sortino ratio?
The Sharpe ratio uses standard deviation, which penalizes both upside price jumps and downside drops equally. The Sortino ratio only measures downside volatility, ignoring upward price gains so that high-performing growth assets are not unfairly penalized for positive price surges.
Disclaimer
This guide was written with AI assistance and reviewed by the StockEmber editorial team for accuracy. StockEmber provides independent education, not personal financial advice. Investing puts your capital at risk: the value of investments can go down as well as up, you may get back less than you invest, and past performance doesn’t guarantee future results. Some links may support our work at no additional cost to you.
The StockEmber Team is our in-house desk of independent research writers. We test brokerage platforms, read the fine print on fees and custody, and cover ETFs and long-horizon investing for people who plan to hold for decades — not days.