The Sharpe ratio is a financial metric that measures an investment portfolio's excess return relative to its total volatility, represented by standard deviation. Calculated by subtracting the risk-free rate from portfolio returns and dividing by standard deviation, it reveals how much return an investor earns for each unit of risk taken.
The Sharpe ratio is a financial metric that measures a portfolio's excess return relative to its total risk, shown through standard deviation. Comparing two investments based solely on total returns can be misleading if one took on twice as much price volatility to achieve that result. Understanding the Sharpe ratio meaning helps long-term investors evaluate whether historical gains justified the price swings along the way. This guide explains what is the Sharpe ratio, how the formula works, how to interpret the results, and why fund fees impact long-term risk-adjusted performance.
Quick Takeaways
01The Sharpe ratio measures how much excess return a portfolio generates for each unit of risk taken.
03The calculation compares portfolio returns against a risk-free benchmark, such as short-term United States Treasury bills.
04High management fees and unexpected market crashes can reduce actual risk-adjusted returns over long holding periods.
What Is the Sharpe Ratio?
Understanding the Sharpe ratio definition begins with the concept of risk-adjusted returns. Developed by Nobel laureate William F. Sharpe, the ratio evaluates whether an investment's profits come from smart asset allocation or simply taking on dangerous price volatility.
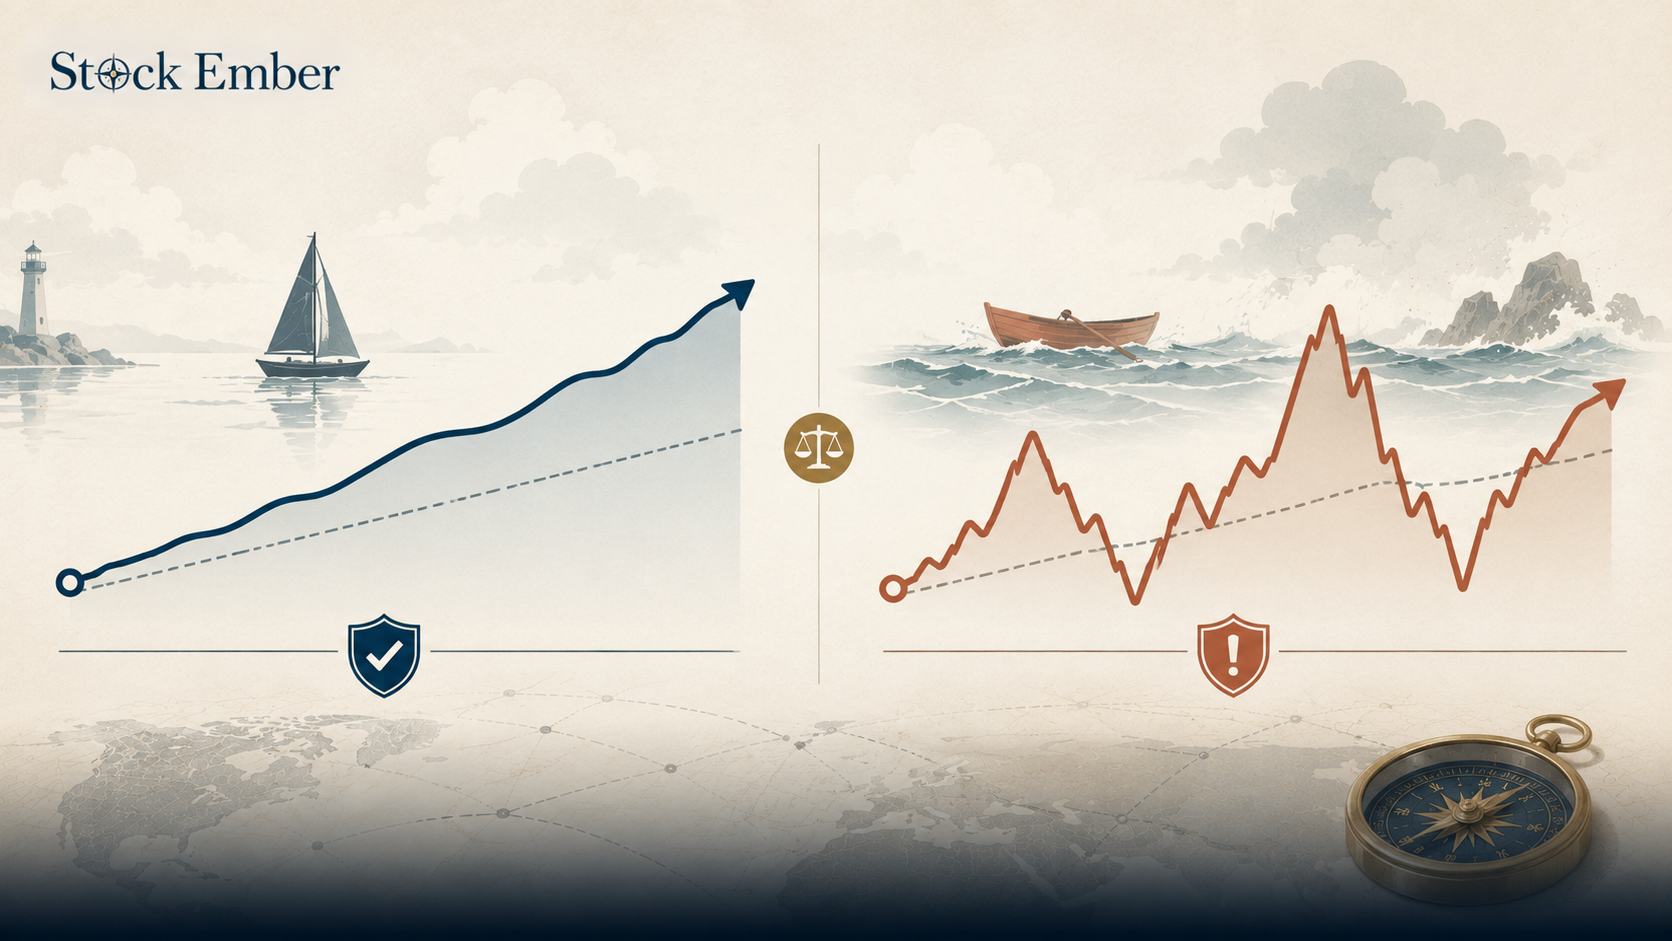
To grasp the core concept, consider two hypothetical funds that both earned a 10% average annual return over five years. Fund A experienced mild price swings of 5% per year, while Fund B suffered sharp price swings of 20% per year. Although both funds delivered identical total returns, Fund A achieved those gains with far less volatility. It quantifies this difference by assigning Fund A a higher score, reflecting superior risk efficiency.
In financial analysis, the Sharpe ratio meaning focuses on excess return, the profit earned above a baseline, risk-free investment. By subtracting the risk-free rate from total portfolio returns, the metric isolates the reward earned specifically for taking market risk.
How to Calculate the Sharpe Ratio
Learning how to calculate Sharpe ratio figures requires three primary data inputs: portfolio return, the risk-free rate, and standard deviation.
The mathematical formula is expressed as:
Sharpe Ratio = (Portfolio Return - Risk-Free Rate) / Standard Deviation
To break down each component:
Portfolio Return: The average annualized percentage gain of the investment over a specific time period.
Risk-Free Rate: The return available on virtually zero-risk investments, typically represented by short-term United States Treasury bills.
Standard Deviation: A statistical measure showing how much portfolio returns fluctuate around their average value, serving as a proxy for total risk.
For example, suppose a stock index fund earns a 12% annual return, short-term Treasury bills yield 2%, and the fund's standard deviation is 10%. Subtracting 2% from 12% leaves an excess return of 10%. Dividing 10% by the 10% standard deviation results in a Sharpe ratio of 1.0.
Sharpe Ratio Benchmark
General Performance Rating
Practical Interpretation
Below 1.0
Underperforming
Generating insufficient excess return for the level of volatility taken.
1.0 to 1.9
Good
Generating adequate excess return relative to price fluctuations.
2.0 to 2.9
Very Good
Delivering strong risk-adjusted returns with controlled volatility.
3.0 or Higher
Excellent
Exceptional risk efficiency; rare over multi-year holding periods.
Why Risk-Adjusted Returns Matter for Long-Term Investors
Looking beyond simple return percentages helps buy-and-hold investors build resilient portfolios that can withstand market turbulence.
Focusing purely on high historical yields often leads investors to take on hidden risks. During long bull markets, speculative funds can display impressive returns that disappear during a sudden market downturn. Using risk-adjusted metrics encourages investors to seek smooth compounding growth rather than volatile, unpredictable swings.
For investors committed to passive investing, tracking broad market index funds through a risk-adjusted lens highlights the advantages of broad asset diversification. Total market index funds naturally moderate single-stock volatility, helping maintain steady risk-adjusted scores over multi-decade time horizons.
In practice, many long-term investors find that comparing ten-year risk-adjusted figures helps them avoid switching funds during short-term market pullbacks.
The Silent Drag: How Fees and Drawdowns Lower Your Real Ratio
While a fund prospectus might advertise an impressive historical risk-adjusted score, high expense ratios and unexpected market drawdowns quietly erode real risk-adjusted gains over time.
Consider the ten-year impact of holding $100,000 in an actively managed fund with a 1.2% annual expense ratio versus a low-cost index fund charging 0.05%. Even if the active fund achieves slightly higher gross risk-adjusted scores, that 1.15% fee difference reduces net returns every single year. Over a ten-year holding period, high fees drag down total excess return, resulting in a lower net risk-adjusted result for the investor. This example is hypothetical for illustration only; actual fees, returns, and outcomes will vary, and no result is guaranteed.
Additionally, sharp market drawdowns can disrupt long-term retirement plans. For investors transitioning from saving to withdrawing capital, erratic price drops introduce sequence of returns risk. Experiencing severe market losses early in retirement forces investors to sell assets at depressed valuations, compounding capital erosion regardless of a fund's multi-year average metrics.
Limitations of the Sharpe Ratio
While this metric is a valuable analytical tool, relying on it blindly can lead to misjudgments due to key mathematical limitations:
Equal Penalty for Upside Volatility: Standard deviation treats unexpected price surges as equal to sudden market drops. An asset that rises sharply is penalized in the calculation, even though upside volatility benefits investors.
Assumption of Normal Distribution: The formula assumes asset returns follow a standard bell curve. In real stock markets, extreme price drops occur more frequently than simple Gaussian statistics predict.
Sensitivity to the Time Horizon: Short-term ratios calculated during smooth bull markets can look artificially strong, failing to reflect long-term market cycle reality.
The U.S. Securities and Exchange Commission notes that evaluating risk-adjusted returns helps investors understand whether portfolio gains stem from sound management or excessive market risk.
Chart comparing portfolio return paths to explain the Sharpe ratio calculation.
Conclusion
Understanding what is the Sharpe ratio transforms how you evaluate investment performance across different market cycles. By comparing excess returns against standard deviation, it reveals whether high gains reflect genuine efficiency or elevated risk taking. While no single metric captures every market nuance, using risk-adjusted measures alongside low expense ratios helps long-term investors construct durable, compounding portfolios.
When you are ready to compare broad market index funds and evaluate low-cost options for your long-term strategy, our ETF reviews offer a practical starting point.
Investing always involves risk of capital loss, and historical risk-adjusted metrics do not guarantee future portfolio results. Treat performance ratios as educational reference points to maintain discipline throughout your investing journey.
FAQ
5 questions
What is the Sharpe ratio meaning and definition?
The Sharpe ratio measures an investment's risk-adjusted return by comparing its excess return above a risk-free rate against its standard deviation (price volatility). It helps investors evaluate whether historical returns resulted from sound strategy or high volatility.
How do you calculate the Sharpe ratio step by step?
To calculate the Sharpe ratio, subtract the risk-free rate (such as US Treasury bill yields) from the portfolio's total return to find the excess return. Then, divide that excess return figure by the portfolio's standard deviation over the same period.
What is considered a good Sharpe ratio?
A Sharpe ratio of 1.0 or higher is generally considered good, indicating the portfolio generates adequate excess return for the risk taken. Ratios above 2.0 are very good, while scores below 0.5 suggest inefficient risk-taking relative to returns.
What are the main limitations of the Sharpe ratio?
The Sharpe ratio penalizes upside price surges equally alongside downside drops because standard deviation measures all price movements. Additionally, it assumes asset returns follow a normal bell curve and can be skewed during short-term bull markets.
What is the difference between portfolio return and excess return?
Portfolio return represents the total percentage gain or loss of an investment. Excess return is the portion of that total return that exceeds a baseline risk-free asset, isolating the specific yield earned for taking on market risk.
Disclaimer
This guide was written with AI assistance and reviewed by the StockEmber editorial team for accuracy. StockEmber provides independent education, not personal financial advice. Some links may support our work at no additional cost to you.
The StockEmber Team is our in-house desk of independent research writers. We test brokerage platforms, read the fine print on fees and custody, and cover ETFs and long-horizon investing for people who plan to hold for decades — not days.