A stock market correction is a price decline of 10% to 20% in a major market index or individual asset from its most recent peak. Corrections serve as natural valuation adjustments that realign stock prices with corporate earnings and economic fundamentals. For long-term investors, market corrections represent routine cooling periods rather than signals of permanent economic disruption.
This type of pullback is a price drop of 10% to 20% in a major market index or individual stock from its most recent peak.
Seeing your portfolio value decline during sudden market drops can feel unsettling. However, temporary price pullbacks are a normal part of long-term market cycles rather than signals of permanent economic ruin. Understanding how a stock market correction works helps you separate routine market fluctuations from long-term financial strategy.
This guide covers how market corrections function, what triggers them, and how disciplined buy-and-hold investors can handle price dips without panic selling.
Quick Takeaways
01A market correction is defined as a price decline between 10% and 20% from a recent market high.
02Corrections occur frequently in equity markets, averaging roughly once every one to two years historically.
03Unlike a bear market, which drops more than 20%, a correction represents a routine cooling period for asset valuations.
04Selling index investments during a correction converts temporary paper losses into permanent capital losses.
05Continuing regular contributions through dollar-cost averaging allows investors to acquire shares at lower price levels.
What Is a Stock Market Correction?
A stock market correction is a temporary decline of 10% to 20% in a stock, bond, commodity, or broad index from its recent peak valuation. When investors ask what is a stock market correction, the technical answer centers on this specific percentage range. If an index like the S&P 500 reaches 5,000 points and drops to 4,300 points, it has entered a 14% correction.
Understanding what is a correction in the stock market requires looking at asset valuations over time. During extended periods of rising prices, stock valuations can become inflated relative to company earnings and underlying economic fundamentals. A stock market correction phase acts as an adjustment mechanism, bringing share prices back into alignment with actual corporate profits and broader economic data.
The formal stock market correction definition distinguishes these drops from smaller day-to-day market noise. While daily price swings of 1% or 2% happen constantly, a full correction represents a clear downward move across broad market sectors. When asking what a stock market correction signals about the broader economy, it is important to remember that corrections do not automatically lead to economic recessions.
Official investor education bulletins published by regulatory bodies like the FINRA emphasize that price drawdowns are regular features of public market investing.
Correction vs. Pullback vs. Bear Market
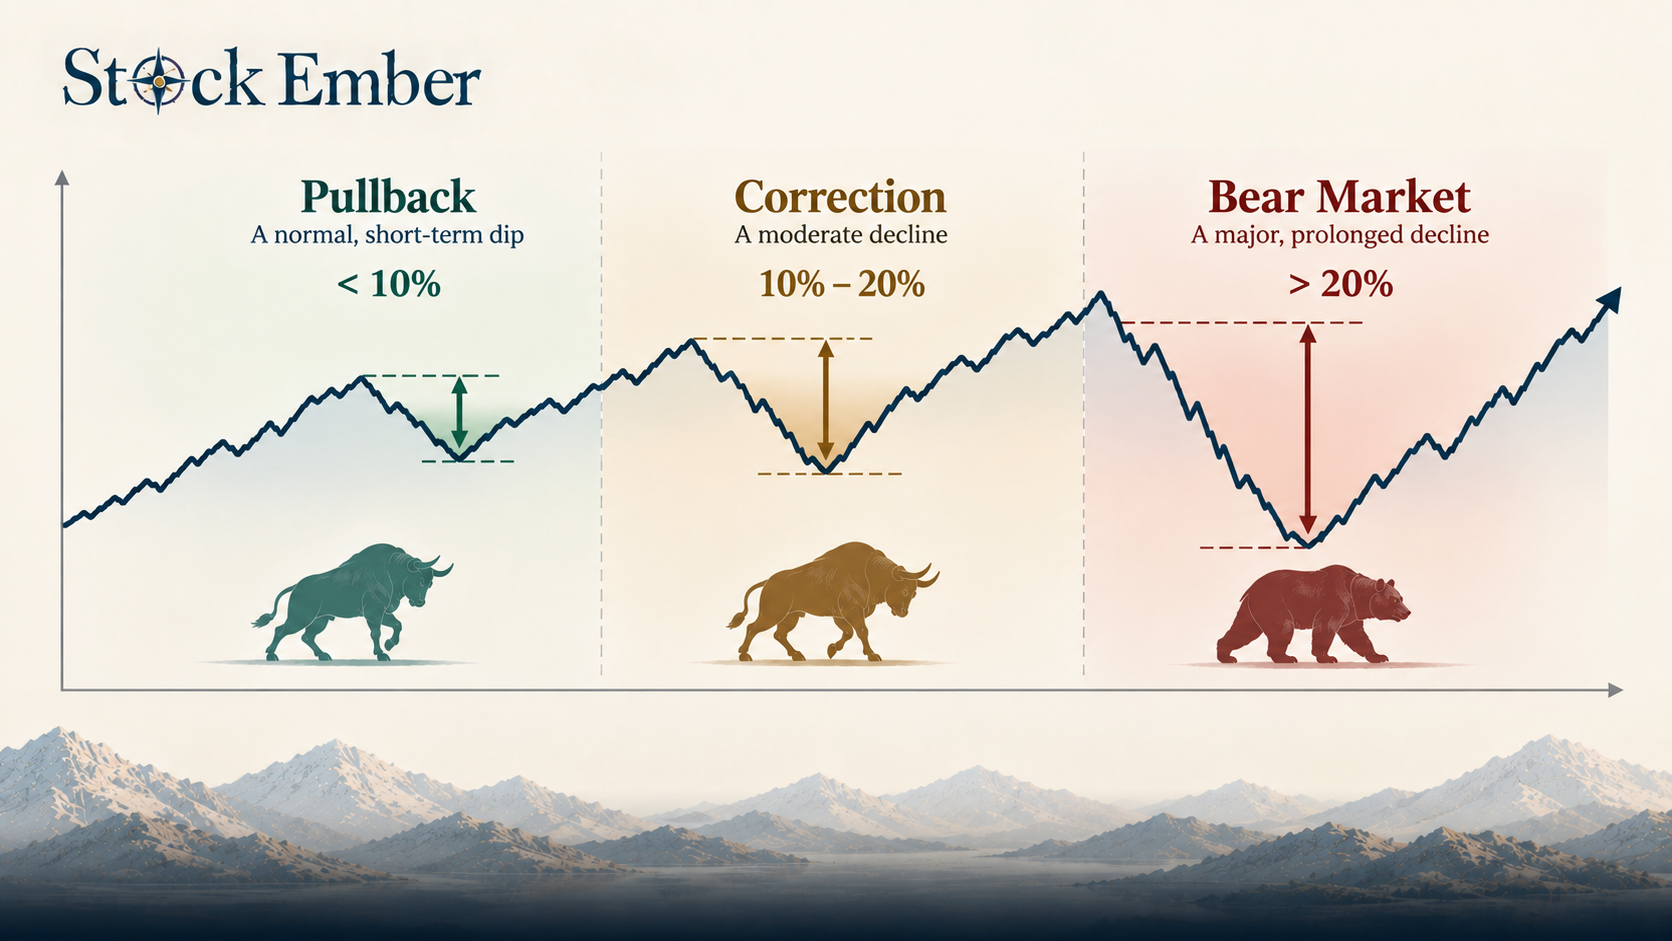
To analyze market drawdowns accurately, investors divide market declines into three distinct categories based on depth and duration.
A market pullback is a mild drop of less than 10% from a peak. Pullbacks happen several times a year, lasting anywhere from a few days to several weeks. They reflect short-term trading shifts and minor profit-taking by institutional investors.
A market correction falls between 10% and 20%. According to historical S&P 500 data compiled by S&P Dow Jones Indices, corrections occur roughly every 1 to 2 years on average and typically last around 3 to 4 months before markets find a bottom and resume their upward path.
A bear market is a severe drop exceeding 20% from recent highs. Bear markets usually accompany economic recessions, falling corporate earnings, and prolonged investor pessimism, lasting significantly longer than standard corrections.
Diagram comparing price drop percentages for market pullbacks, corrections, and bear markets
Market Phase
Price Decline Threshold
Average Historical Duration
Primary Market Driver
Pullback
Less than 10% drop
Days to weeks
Short-term profit taking
Market Correction
10% to 20% drop
3 to 4 months
Valuation realignment
Bear Market
Greater than 20% drop
9 to 18 months
Recession & structural shifts
Note: Based on historical U.S. equity market data from S&P Dow Jones Indices.
Common Triggers: What Causes a Market Correction?
Market corrections rarely stem from a single isolated event. Instead, they occur when multiple economic pressures cause investors to re-evaluate share prices simultaneously.
One primary trigger is valuation overheating. When stock prices rise faster than corporate earnings for an extended period, market ratios expand to unsustainable levels. Eventually, institutional buyers pause their purchases, and sellers take profits, causing prices to fall back toward historical averages.
Macroeconomic shifts also play a major role. Changes in central bank interest rate policies, shifts in employment data, and consumer spending trends influence market direction. For instance, learning what causes inflation clarifies how rising input costs prompt central banks to raise interest rates. Higher interest rates increase borrowing costs for businesses, which can lower future profit expectations and trigger equity sell-offs.
Geopolitical tension and unexpected corporate earnings reports can also serve as immediate catalysts. While these news events often trigger the initial selling pressure, the underlying cause of the correction is usually the market cooling off after a period of rapid expansion.
Portfolio Strategy During a Correction
For long-term investors, market corrections are an unavoidable part of the broader market cycle. Attempting to predict when a correction will start or end is extremely difficult, and switching to cash during price drops often harms long-term returns.
When share prices fall, investors experience paper losses, a decline in market value on screen. A paper loss only becomes a permanent loss if you sell your holdings at lower prices. Historically, major U.S. stock market indexes such as the S&P 500 have recovered from past corrections to reach new highs over multi-year horizons, according to long-term data from S&P Dow Jones Indices. Liquidating portfolio holdings during a decline risks missing the initial rally days that often follow market bottoms.
In practice, many long-term investors find that viewing market corrections as temporary sales on broad index funds makes it easier to stay calm during market volatility.
Maintaining a disciplined investment strategy during a correction involves key practices:
Automated Contributions: Maintaining regular monthly purchases through dollar-cost averaging ensures you purchase more fund shares when prices are discounted.
Rebalancing: Adjusting your portfolio back to your target asset allocation by buying underperforming asset classes using cash or overperforming assets.
Focusing on Time Horizon: Reminding yourself that short-term price swings matter very little if your investment horizon extends 10, 20, or 30 years into the future.
Common Investor Pitfalls to Avoid
Behavioral biases often lead investors to make emotional choices during periods of market stress. Avoiding these common traps helps protect long-term portfolio growth.
Panic Selling at Lows: Selling stock index holdings during the middle of a correction out of fear that prices will fall further. This locks in losses and removes your capital from future recovery phases.
Pausing Investment Plans: Halting regular monthly contributions until market conditions "feel safe." Markets usually recover before economic news improves, so waiting often means buying back at higher prices.
Attempting Market Timing: Holding large amounts of cash in an attempt to buy at the exact market bottom. Market bottoms are clear only in hindsight, and sitting on the sidelines carries a heavy opportunity cost.
Conclusion
Stock market corrections are normal, recurring events in broad equity investing. While price declines between 10% and 20% can create short-term uncertainty, history shows that corrections are temporary valuation adjustments rather than permanent financial disruptions.
Staying disciplined through market pullbacks helps protect your long-term portfolio from emotional decisions like panic selling or market timing. By maintaining continuous contributions and focusing on multi-decade horizons, you allow compound growth to continue working across full market cycles.
When you are ready to construct a resilient portfolio designed for market volatility, exploring our guides in ETF reviews is a helpful next step. Investing always involves the risk of loss and past market performance does not guarantee future results, so treat this educational overview as a foundation for your personal financial research
FAQ
5 questions
What is a stock market correction?
A stock market correction is a decline of 10% to 20% in a stock market index or asset from its recent peak level. It represents a routine cooling period where asset valuations realign with fundamental economic data and corporate earnings.
How long does a stock market correction usually last?
Historically, a stock market correction lasts about three to four months. While individual pullbacks vary in duration, broad index corrections are typically much shorter than bear markets, which can last a year or more.
What triggers a stock market correction?
Market corrections are triggered by multiple factors, including asset valuation overheating, shifts in central bank interest rate policies, inflation pressures, disappointing corporate earnings reports, and unexpected geopolitical events that prompt widespread profit-taking by investors.
What is the difference between a market correction and a bear market?
The primary difference is the depth of the price decline. A market correction is a drop between 10% and 20% from a recent peak, while a bear market is a drop exceeding 20%. Bear markets usually last longer and are accompanied by economic recessions.
Q5: Should long-term investors sell during a stock market correction?
Long-term index investors generally avoid selling during a market correction. Selling converts temporary paper losses into permanent capital losses and hazards missing the initial recovery days. Maintaining regular contributions through dollar-cost averaging helps investors acquire shares at lower valuations.
Disclaimer
This guide was written with AI assistance and reviewed by the StockEmber editorial team for accuracy. StockEmber provides independent education, not personal financial advice. Some links may support our work at no additional cost to you.
The StockEmber Team is our in-house desk of independent research writers. We test brokerage platforms, read the fine print on fees and custody, and cover ETFs and long-horizon investing for people who plan to hold for decades — not days.