The Russell 2000 Index is a market-capitalization-weighted financial benchmark that measures the price performance of approximately 2,000 small-cap U.S. companies. It captures the bottom two-thirds of the broader Russell 3000 Index, serving as the leading benchmark for domestic American small-cap equity performance. Investors access the Russell 2000 primarily through index-tracking mutual funds and exchange-traded funds (ETFs).
The Russell 2000 Index is a market-capitalization-weighted financial benchmark that tracks the stock performance of approximately 2,000 small-cap U.S. companies.
When evaluating American stock performance, investors often focus on large-cap names in the S&P 500. However, tracking smaller public businesses provides a distinct view of domestic economic activity. This guide explains how the Russell 2000 measures small-cap equities, how it compares to alternative benchmarks, and what structural factors affect long-term fund returns.
If you're wondering what is the Russell 2000 and how it fits into a diversified portfolio, understanding its construction is the first step.
Quick Takeaways
01The Russell 2000 Index measures the price performance of approximately 2,000 smaller stocks within the broader Russell 3000 Index.
02FTSE Russell maintains the index using free-float market-capitalization weighting and reconstitutes the index annually each June.
03Unlike the S&P SmallCap 600, the Russell 2000 includes non-profitable companies, which can contribute to greater index volatility and earnings variance.
04Investors access small-cap exposure through index funds and exchange-traded funds rather than buying index components directly.
05Higher turnover during the annual reconstitution and wider trading spreads create tracking drag over a 10-year holding period.
What Is the Russell 2000 Index?
The Russell 2000 Index is the primary benchmark for measuring the performance of small-cap companies in the United States. Created in 1984 by the Frank Russell Company and now maintained by FTSE Russell, the index captures the bottom two-thirds of the broader Russell 3000 Index.
To understand how the benchmark fits into the market, it helps to examine the Russell US index family:
Russell 3000 Index: Measures the 3,000 largest publicly traded U.S. companies, representing approximately 98% of investable U.S. equities by market capitalization, according to FTSE Russell as of the June 2026 reconstitution.
Russell 1000 Index: Captures the top 1,000 largest companies from the Russell 3000, representing large-cap stock performance.
Russell 2000 Index: Tracks approximately 2,000 smaller companies from the Russell 3000, serving as a leading U.S. small-cap benchmark.
While large-cap indices like the S&P 500 are dominated by multinational tech giants, the Russell 2000 reflects domestic American businesses that rely heavily on local economic activity, consumer spending, and regional credit conditions.
How the Russell 2000 Works: Construction and Weighting
Understanding how the index operates requires looking at its weighting formula and constituent criteria. The Russell 2000 uses free-float market-capitalization weighting. Free-float weighting counts only the shares available to the public, excluding restricted insider shares or government stakes.
In a market-cap weighted index, larger small-cap firms hold a larger proportion of the index than the smallest members. However, because the total market valuation of approximately 2,000 constituent companies combined is far smaller than the S&P 500, individual movements within the Russell 2000 do not dominate the index in the same way tech giants influence large-cap benchmarks.
FTSE Russell reconstitutes the index once per year, effective each June. During this annual reset, FTSE Russell re-ranks eligible U.S. equities by market capitalization, allowing companies to move between the Russell 1000 and Russell 2000 as their relative market size changes.
Russell 2000 vs. S&P SmallCap 600: The Profitability Filter Gap
When allocating capital to U.S. small caps, investors often compare the Russell 2000 against the S&P SmallCap 600. While both capture smaller public companies, their screening criteria produce noticeably different portfolios.
The primary difference centers on earnings eligibility:
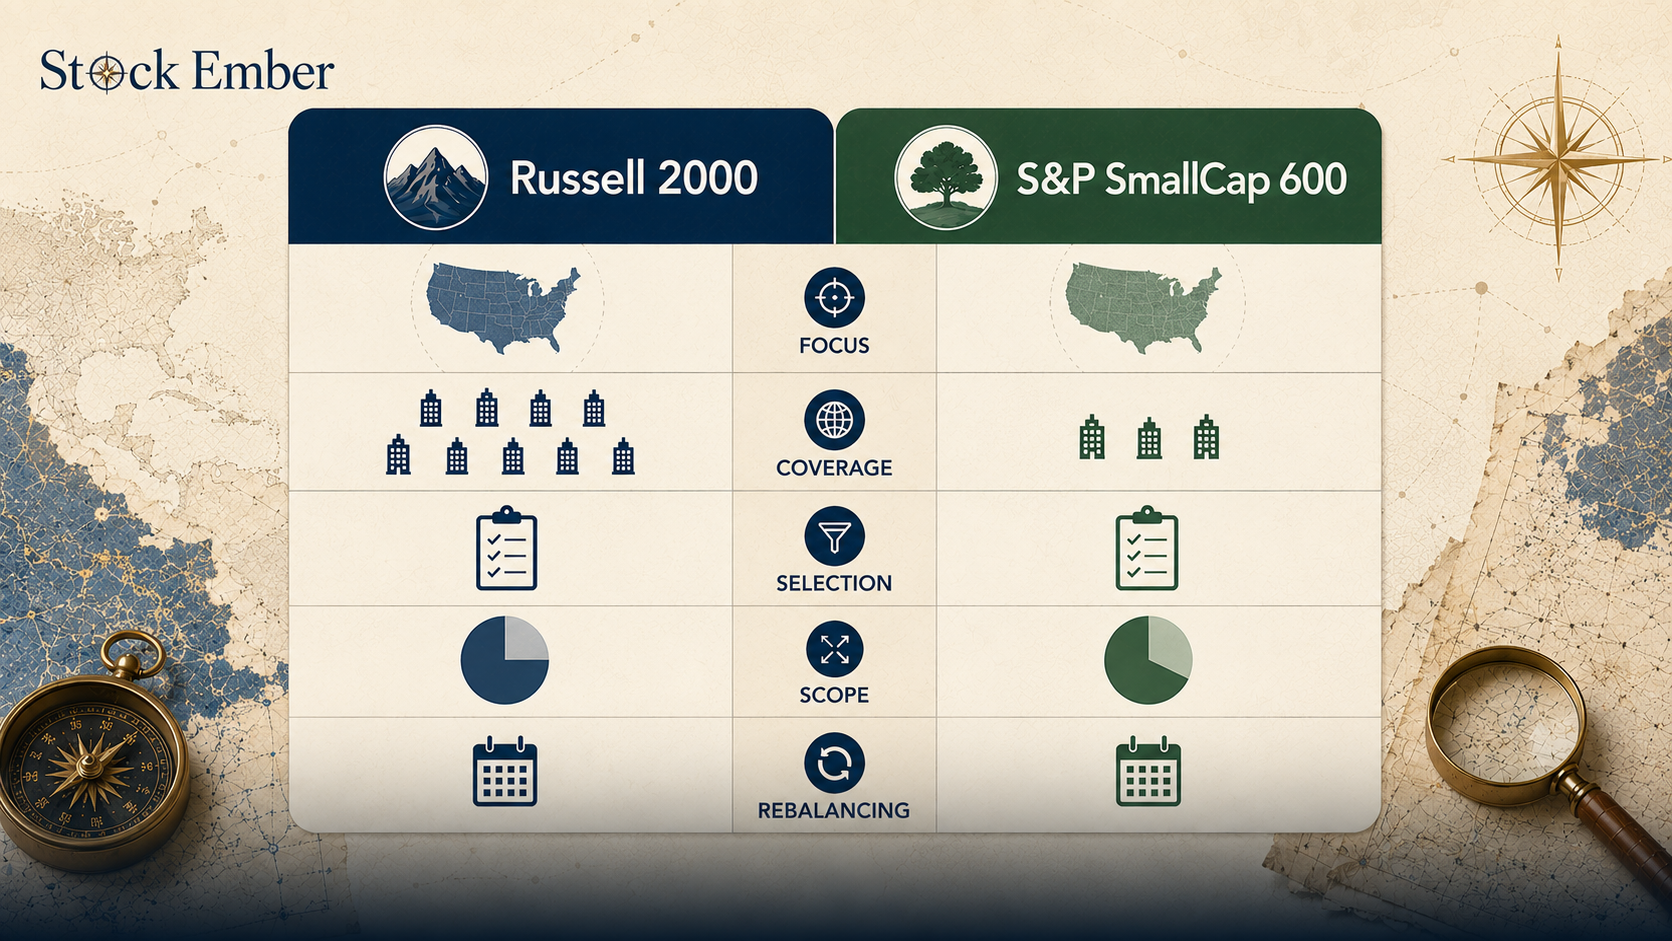
Russell 2000: Does not require positive corporate earnings for inclusion. Eligible companies are selected using market-capitalization and other investability criteria. As a result, approximately 40% of the constituent companies in the Russell 2000 do not generate positive net profits.
S&P SmallCap 600: Applies a profitability filter requiring member companies to report positive earnings over the most recent quarter and across the sum of the trailing four quarters.
This earnings gap means the Russell 2000 can include more companies that are earlier in their business lifecycle, reinvesting heavily, in cyclical downturns, or not yet profitable. These composition differences can cause the Russell 2000 and S&P SmallCap 600 to behave differently across market cycles.
Comparison chart highlighting profitability requirements between Russell 2000 and S&P SmallCap 600.
How to Invest in the Russell 2000: ETFs, Mutual Funds, and Reconstitution Drag
Because an index is simply a theoretical rulebook, you cannot purchase the benchmark directly. To gain exposure, investors buy pooled funds that hold the underlying stocks. Learning what an index is explains how theoretical benchmarks guide real portfolio construction.
Most investors access small-cap stocks through exchange-traded funds. Reviewing what an ETF is helps clarify how passive funds trade on public exchanges to replicate benchmark holdings.
However, tracking 2,000 small-cap equities creates an operational challenge known as reconstitution drag. Every June, when FTSE Russell announces index changes, institutional traders and hedge funds anticipate which stocks will be added or removed. These market participants buy incoming stocks early, bidding up share prices before index funds can complete their required purchases.
This pre-reconstitution price surge forces passive funds to buy incoming stocks at elevated prices and sell outgoing stocks at depressed valuations, creating subtle trading drag for long-term unit holders.
10-Year Cost Math: Expense Ratios, Turnover, and Small-Cap Drag
Small-cap index funds can incur higher trading frictions than large-cap S&P 500 funds because smaller stocks may be less liquid and trade with wider market spreads, while index reconstitution can increase portfolio turnover.
Consider a hypothetical $10,000 investment held over a 10-year period, assuming a baseline annual gross market return of 8%. This example is illustrative only, and actual returns will vary:
Theoretical Russell 2000 Index: Grows to approximately $21,589 in pure calculation space.
Low-Cost Small-Cap ETF (0.10% Total Drag): Yields a net return of 7.90% per year, turning $10,000 into roughly $21,390 after 10 years, a modest $200 total cost impact.
Higher-Cost Small-Cap Fund (0.50% Total Friction): An expensive fund charging a 0.35% expense ratio plus 0.15% in trading and reconstitution drag yields 7.50% net per year, ending at approximately $20,610.
That 0.40% annual difference in total drag deprives the long-horizon investor of nearly $780 in compound growth over a decade. Choosing low-fee tracking vehicles helps keep real portfolio growth aligned with theoretical market returns.
Small-Cap Risks: Volatility, Debt Burdens, and Interest Rate Sensitivity
Small-cap stocks offer long-term growth potential, but they carry distinct risk characteristics compared to established market leaders:
Higher Share Price Volatility: Small companies experience wider price swings due to lower daily trading volumes and smaller market capitalizations.
Interest Rate Vulnerability: Smaller businesses often rely on short-term bank loans and floating-rate debt rather than fixed-rate corporate bonds. When central banks raise interest rates, borrowing costs increase rapidly for small-cap firms.
Business Failure Risk: Early-stage and unprofitable businesses face higher insolvency rates during recessions or prolonged credit squeezes.
In practice, many long-term investors allocate a controlled percentage of their total portfolio to small-cap indices, balancing growth potential against large-cap stability.
Conclusion
The Russell 2000 remains the premier benchmark for measuring U.S. small-cap equity performance. By capturing 2,000 smaller public companies, the index provides broad exposure to domestic economic activity and early-stage corporate expansion.
However, because the benchmark includes a high proportion of unprofitable firms and faces annual rebalancing drag, long-term investors should evaluate fund costs and sector exposure carefully. Combining low-cost index tracking with a multi-year horizon helps absorb short-term volatility while capturing small-cap market growth over time.
When you are ready to compare small-cap funds and evaluate fee structures, our ETF reviews provide clear breakdowns of structural expenses and tracking quality.
Investing in small-cap equities involves risk of capital loss, higher price volatility, and potential underperformance during economic recessions, so treat this educational guide as a foundation for your personal portfolio research.
FAQ
5 questions
What is the Russell 2000 Index?
The Russell 2000 Index is a U.S. stock market benchmark that tracks roughly 2,000 small-capitalization public companies. Managed by FTSE Russell, it represents the lower two-thirds of the broad Russell 3000 Index, providing exposure to smaller domestic American businesses across diverse industry sectors.
Can you buy the Russell 2000 Index directly?
No, you cannot buy the Russell 2000 Index directly because it is a mathematical calculation tool rather than a tradable financial security. Investors gain exposure by purchasing shares of index mutual funds or exchange-traded funds (ETFs) that hold the benchmark's underlying constituent stocks.
What is the difference between the Russell 2000 and the S&P SmallCap 600?
The primary difference is profitability screening. The Russell 2000 includes small-cap companies based solely on market capitalization rules, leading to a high proportion of unprofitable firms. In contrast, the S&P SmallCap 600 requires companies to report positive net earnings over recent quarters before inclusion.
What is the difference between the Russell 1000 and the Russell 2000?
Both indices are subsets of the broader Russell 3000 Index. The Russell 1000 tracks the top 1,000 largest U.S. publicly traded companies, representing large-cap performance. The Russell 2000 tracks the remaining 2,000 smaller companies, representing small-cap market performance.
What causes tracking drag in Russell 2000 ETFs?
Tracking drag in small-cap funds is caused by annual management expense ratios, trading costs from wider bid-ask spreads in illiquid shares, cash holdings, and reconstitution drag—price friction caused when institutional investors anticipate annual June index additions and deletions.
Disclaimer
This guide was written with AI assistance and reviewed by the StockEmber editorial team for accuracy. StockEmber provides independent education, not personal financial advice. Some links may support our work at no additional cost to you.
The StockEmber Team is our in-house desk of independent research writers. We test brokerage platforms, read the fine print on fees and custody, and cover ETFs and long-horizon investing for people who plan to hold for decades — not days.