The MSCI Emerging Markets Index is a free-float market-capitalization-weighted benchmark that measures the equity performance of large- and mid-cap stocks across 24 developing economies. It serves as a global market benchmark for tracking economic growth in emerging regions like East Asia, Latin America, and Eastern Europe. Investors cannot purchase the index directly, but gain exposure through index funds and exchange-traded funds (ETFs) that hold its underlying constituent stocks.
This benchmark is a free-float market-capitalization-weighted index that measures the price performance of large- and mid-cap stocks across 24 developing economies worldwide.
When constructing a diversified global portfolio, allocation strategies frequently look beyond mature markets to capture expansion in fast-growing developing nations. Yet investing across international borders introduces distinct political, regulatory, and foreign exchange dynamics. This guide breaks down index mechanics, country allocation split differences, structural fees, and what long-term investors should evaluate when tracking developing markets.
Quick Takeaways
01The MSCI Emerging Markets Index measures equity performance across 24 developing economies using free-float market-capitalization weighting.
02East Asian economies, including Taiwan, China, and South Korea, account for more than 60% of total index weight, according to MSCI's index factsheet.
03MSCI classifies South Korea as an emerging market, whereas FTSE classifies it as a developed market, creating portfolio allocation differences between competing ETFs.
04Over a 10-year holding period, higher ETF management fees, foreign dividend withholding taxes, and currency drag cause real returns to trail raw benchmark figures.
What Is the MSCI Emerging Markets Index?
The MSCI Emerging Markets Index is an equity benchmark created by MSCI Inc. to measure stock market performance across developing nations. Launched in 1988 with just 10 countries, the benchmark now covers over 1,100 constituent stocks across 24 emerging market economies. As documented by MSCI, the index targets approximately 85% of the free-float adjusted market capitalization in each target country.
To understand MSCI emerging markets tracking, investors must look at free-float market capitalization. Free-float weighting counts only the shares available for public trading, excluding government-held stakes or restricted insider holdings. This calculation method prevents illiquid corporate holdings from distorting the benchmark's value and ensures that index movements reflect actual tradable market volume.
By maintaining rule-based inclusion criteria, the index serves as the primary performance yardstick for institutional investors, sovereign wealth funds, and retail asset managers tracking global developing market growth.
Geographic and Sector Composition: Top Countries and Holdings
The geographic weight of the index leans heavily toward major Asian economies, particularly East Asian manufacturing and technology markets. Free-float-adjusted market capitalization determines country weight, meaning larger corporate markets exert a greater influence on overall index movements.
The primary country allocations within the benchmark include:
China: Represents a major portion of the index through listed offshore shares and qualified onshore equities.
Taiwan: Holds a heavy allocation, largely driven by world-leading semiconductor foundries.
India: Represents a significant share supported by technology services, banking, and consumer demand.
South Korea: Classified as an emerging market under MSCI criteria, contributing major consumer electronic and industrial conglomerates.
Sector weights are similarly focused. Information Technology and Financials account for the largest individual sector allocations, followed by Consumer Discretionary, Industrials, and Communication Services. Top constituent holdings feature global market leaders such as Taiwan Semiconductor Manufacturing Co. (TSMC), Samsung Electronics, and Tencent Holdings.
This heavy concentration means that downturns in East Asian tech hardware or regulatory shifts in major Asian economies heavily impact total index returns.
MSCI vs. FTSE Emerging Markets: The South Korea Classification Split
A common source of confusion for international investors is why two popular emerging market funds hold different country lists. The distinction comes down to how index providers classify market accessibility.
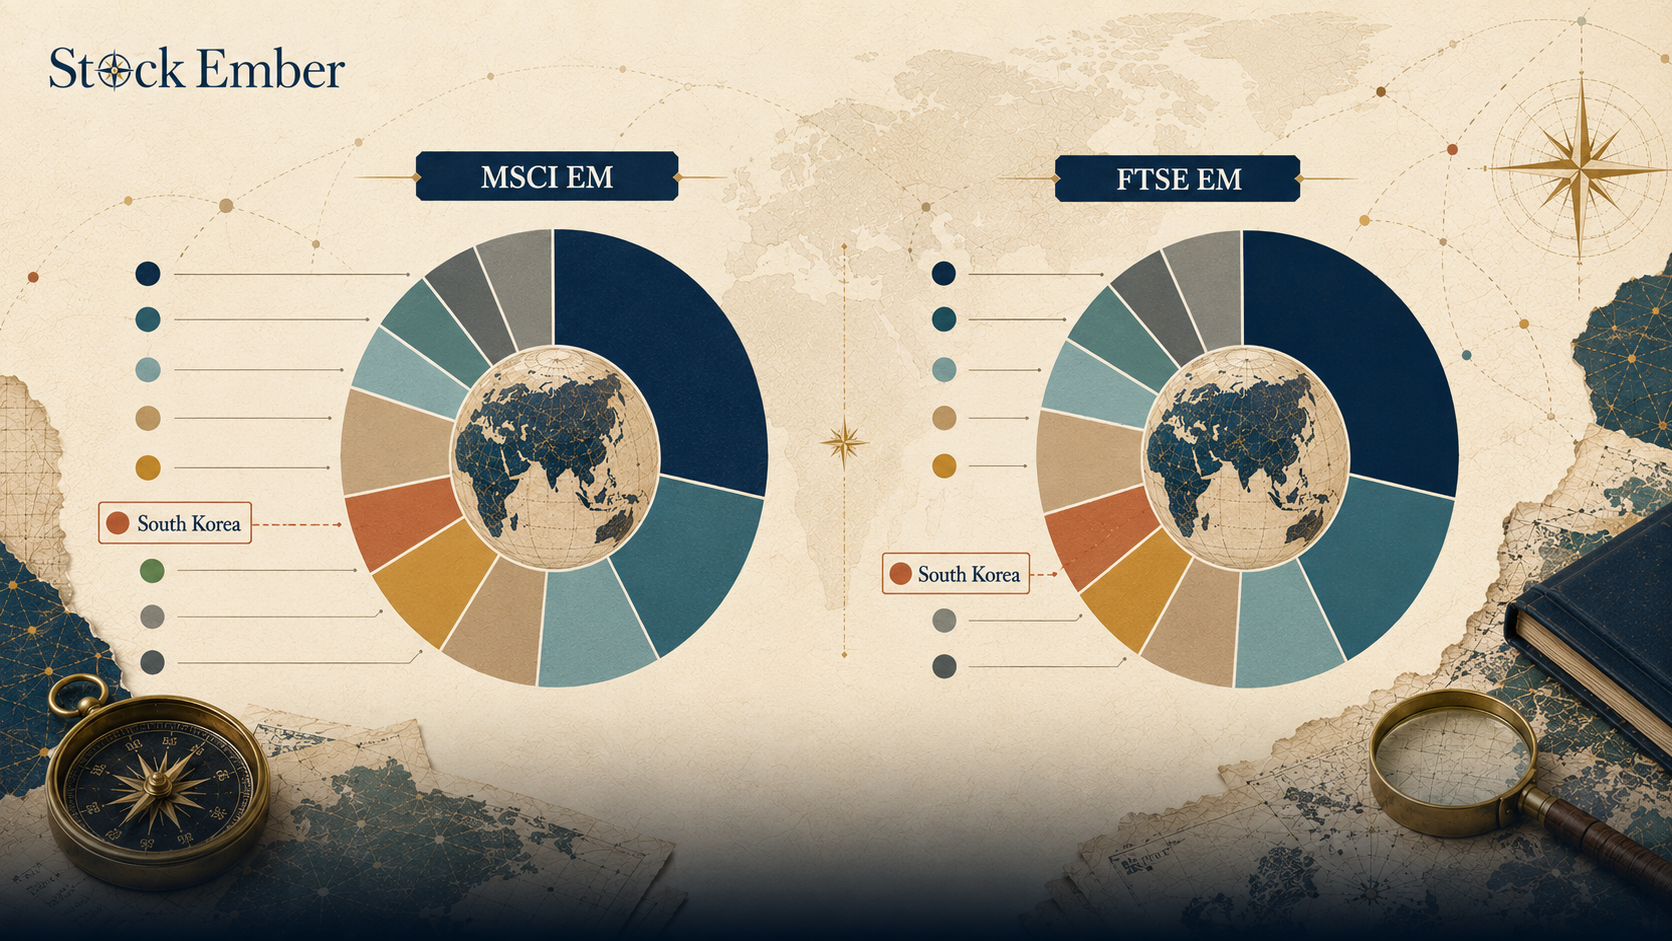
When evaluating emerging markets MSCI benchmarks against FTSE indexes, the main difference centers on South Korea. Is South Korea included in MSCI Emerging Markets? Yes, MSCI continues to classify South Korea as an emerging market due to foreign exchange market restrictions and settlement process inefficiencies. In contrast, FTSE classifies South Korea as a developed market.
Comparison chart showing how MSCI and FTSE classify South Korea in emerging market indices.
This classification split creates structural differences for investors buying passive funds:
MSCI-Based Funds: Include South Korea as a major top-three country allocation alongside China and Taiwan.
FTSE-Based Funds: Exclude South Korea entirely from their emerging market indexes, shifting that weight into their developed market international products.
Neither classification approach is inherently superior, but holding both index types across different accounts can lead to unintended gaps or overlaps in South Korean stock exposure.
How to Gain Exposure: ETFs, Index Mutual Funds, and Liquidity
Because investors cannot buy a mathematical index directly, market participants gain exposure through index-tracking mutual funds or exchange-traded funds. Understanding what an ETF is clarifies how these pooled holding vehicles trade on public exchanges to replicate underlying benchmark baskets.
When purchasing a fund that tracks developing nations, investors should evaluate physical replication versus sampling methods. Full physical replication buys every single stock in the index, which can become costly across 24 different international exchanges. Optimized sampling buys a representative subset of stocks that mirrors the index's core risk and return characteristics while keeping transaction expenses down.
Trading international funds also requires attention to underlying ETF liquidity. The underlying Asian, Latin American, and European exchanges operate across different time zones. As a result, an ETF's market price can briefly trade at a premium or discount to its net asset value when local markets are closed.
In practice, many long-term investors prefer physical replication funds over synthetic derivatives to avoid counterparty risk, the chance that the institution on the other side of a derivative contract fails to meet its obligations, when holding international equities over a multi-year horizon.
The Cost of Tracking: Expense Ratios, Withholding Taxes, and Currency Drag
Holding international stocks incurs operational costs that reduce net returns over time. Over a multi-year investment horizon, these small cost frictions accumulate into measurable benchmark drag.
Consider a hypothetical $10,000 investment held over 10 years, assuming a baseline index growth rate of 6% per year:
Raw Benchmark Index: Grows to approximately $17,908 in pure calculation space.
Low-Cost EM ETF (0.10% Expense Ratio): Achieves a net return of 5.90% per year, compounding to roughly $17,740 after 10 years, a modest $168 fee impact.
High-Cost EM ETF (0.75% Expense Ratio): Delivers a net return of 5.25% per year, ending at approximately $16,681 after 10 years, leaving $1,227 less in cumulative wealth.
These figures are illustrative only, based on a constant hypothetical return; actual index and fund performance will fluctuate and cannot be guaranteed.
Beyond annual fund expense ratios, long-horizon performance is affected by foreign dividend withholding taxes and currency exchange drag. When foreign corporations pay dividends, host governments often withhold taxes before funds flow back to the fund provider. Furthermore, because underlying assets are priced in local currencies, a rising US dollar can reduce converted fund returns even when local stock prices remain steady.
Structural Risks in Emerging Market Benchmark Investing
While developing markets offer exposure to favorable demographics and expanding consumer classes, they carry higher downside risk than developed market equities:
Geopolitical and Political Volatility: Governments in developing nations may introduce sudden regulatory changes, capital controls, or foreign ownership limits that impact share values.
Currency Depreciation Risk: Weakening local currencies against major global currencies can erase local equity market gains for foreign investors.
Single-Country Concentration: Because a small group of large markets dominates index weighting, domestic economic challenges in top-weighted countries heavily influence total benchmark returns.
Conclusion
Evaluating MSCI emerging markets index performance over full economic cycles shows that developing market equities experience wider price swings and longer recovery periods than mature market indexes. Incorporating emerging market exposure into a long-term portfolio provides broad global diversification, but requires patience to ride out extended periods of market underperformance.
To minimize friction when building an international allocation, focus on low-cost funds that offer transparent physical tracking and competitive expense ratios. When you are ready to evaluate individual funds and compare fee structures, our ETF reviews provide clear evaluations of tracking quality and structural expenses.
All equity investments carry risk of capital loss, and past benchmark returns do not guarantee future performance, so use this guide as a baseline for your personal portfolio research.
FAQ
5 questions
Is South Korea included in the MSCI Emerging Markets Index?
Yes, MSCI classifies South Korea as an emerging market, giving it a significant weight alongside China, Taiwan, and India. In contrast, FTSE classifies South Korea as a developed market, which creates allocation differences between ETFs tracking these competing index providers.
Can you invest directly in the MSCI Emerging Markets Index?
No, you cannot invest directly in the MSCI Emerging Markets Index because it is a mathematical calculation benchmark rather than a tradable security. To gain exposure, investors buy index-tracking mutual funds or exchange-traded funds (ETFs) that physically or synthetically replicate the index's underlying stock basket.
What are the main country weightings in the MSCI Emerging Markets Index?
The index is heavily weighted toward East Asian economies, with Taiwan, China, India, and South Korea collectively representing over 60% of total portfolio value. The remaining weight is distributed across other developing regions in Latin America, Emerging Europe, the Middle East, and Africa.
What is the difference between MSCI World and MSCI Emerging Markets?
The MSCI World Index tracks large- and mid-cap stocks strictly across developed nations, such as the United States, Japan, and Western Europe. The MSCI Emerging Markets Index tracks equities across developing nations with rapidly growing economies but higher political, regulatory, and currency risks.
Why does tracking error occur in emerging market ETFs?
Tracking error between an emerging market ETF and its underlying MSCI benchmark is caused by annual management fees (expense ratios), cash reserves, cross-border dividend withholding taxes, local currency conversion costs, and transaction fees paid when trading across multiple international exchanges.
Disclaimer
This guide was written with AI assistance and reviewed by the StockEmber editorial team for accuracy. StockEmber provides independent education, not personal financial advice. Some links may support our work at no additional cost to you.
The StockEmber Team is our in-house desk of independent research writers. We test brokerage platforms, read the fine print on fees and custody, and cover ETFs and long-horizon investing for people who plan to hold for decades — not days.