An economic cycle diagram is a visual chart plotting Real GDP fluctuations around a long-term potential growth trend line. It illustrates four sequential phases: expansion, peak, contraction, and trough. Investors use the diagram to frame macroeconomic trends, though equity prices typically lead backward-looking economic data.
This visual model tracks fluctuations in Real Gross Domestic Product (GDP) over time around a long-term potential growth trend line.
When news headlines warn of economic slowdowns or market peaks, visual models help put temporary swings into perspective. Seeing how economic output moves through standard phases helps long-term investors stay grounded instead of making emotional choices.
This guide breaks down the four main phases of the diagram, explains why stock market prices lead economic data, and shows how buy-and-hold investors can use the chart for long-term clarity.
Quick Takeaways
01An economic cycle chart plots Real GDP against time to illustrate short-term economic expansions and contractions.
02The model features four main phases: expansion, peak, contraction (recession), and trough.
03Economic cycles track lagging GDP data, whereas stock prices usually lead real economic activity by six to nine months.
04The long-run trend line shows that temporary contractions do not derail structural economic growth over ten-year periods.
The Anatomy of an Economic Cycle Diagram
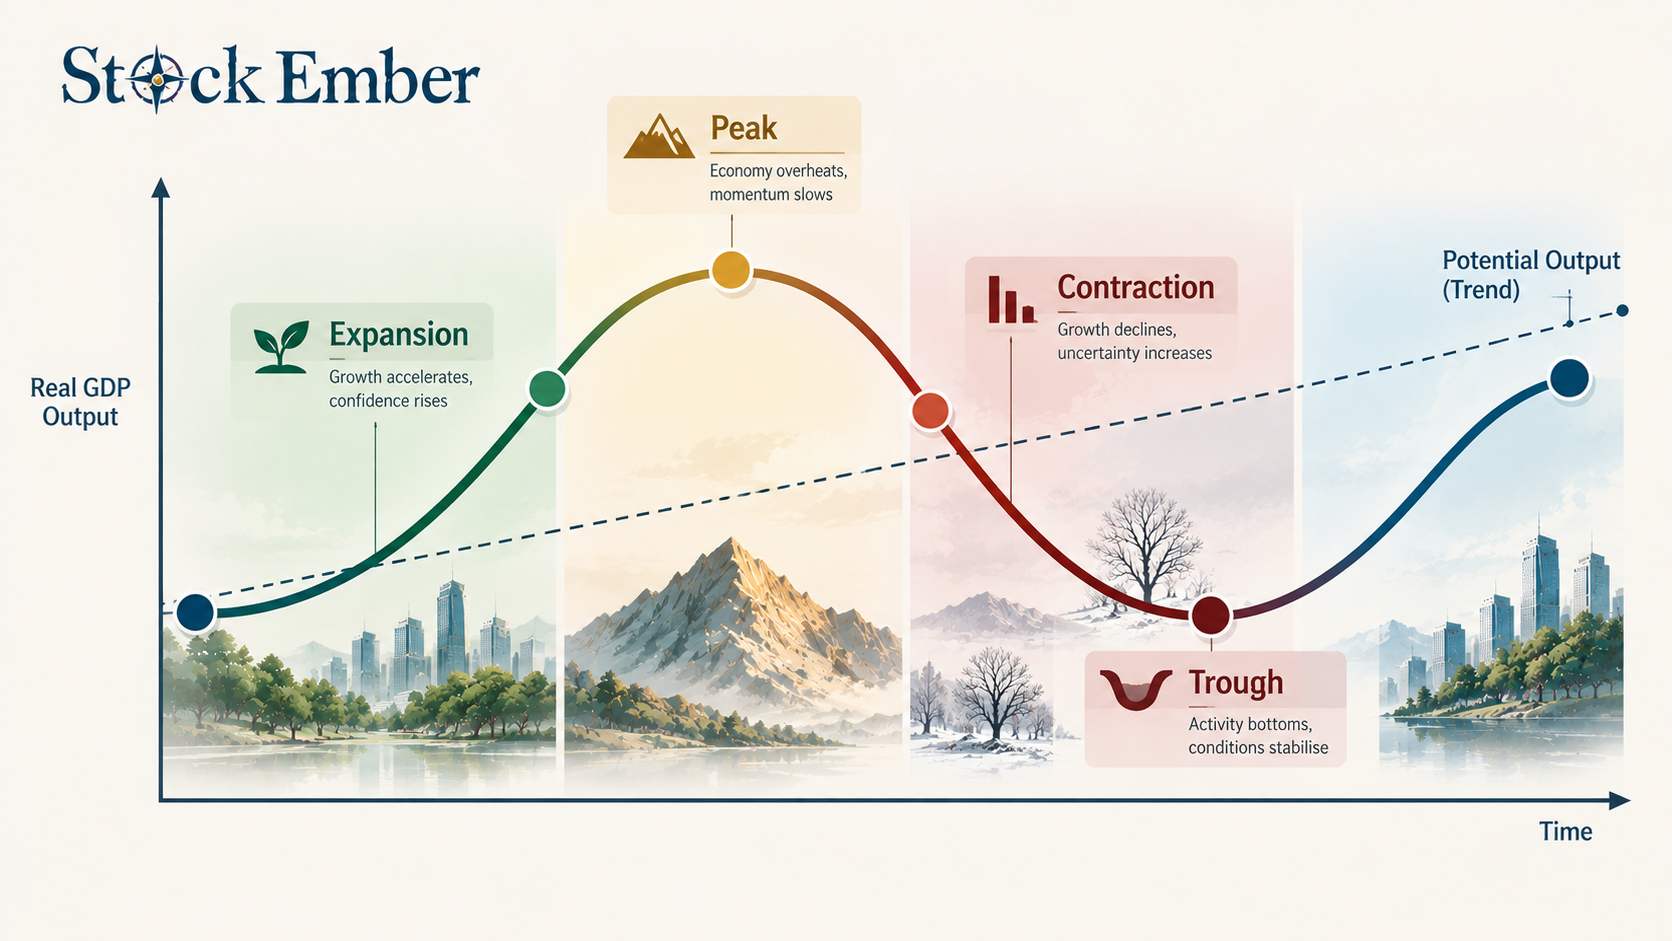
This chart uses a simple grid to show how national output moves above and below its long-term path over time.
Diagram of four economic cycle phases plotted against a potential GDP trend line.
The horizontal axis (X-axis) tracks time across months or years, while the vertical axis (Y-axis) measures real economic output, typically represented by Real GDP. Across this grid, a smooth, upward-sloping line shows the economy's potential long-term growth line. The actual economic path waves up and down around this baseline across four clear stages:
Expansion: Economic activity speeds up. Businesses hire workers, consumer spending grows, and real output increases.
Peak: Economic output reaches its highest point in the current cycle. At this stage, employment is high, but capacity limits and price inflation often begin to build up.
Contraction (Recession): Economic output slows down. Business investment declines, hiring cools, and spending falls off.
Trough: The bottom of the downturn, where economic output stops dropping and begins turning upward into the next expansion phase.
Data published by institutions like the St. Louis Fed shows that these swings are a natural part of modern market economies rather than signs of permanent decay.
Economic Cycle vs. Stock Market Cycle: The 6-Month Gap
An economic cycle measures backward-looking output data, whereas a market cycle reflects forward-looking investor expectations.
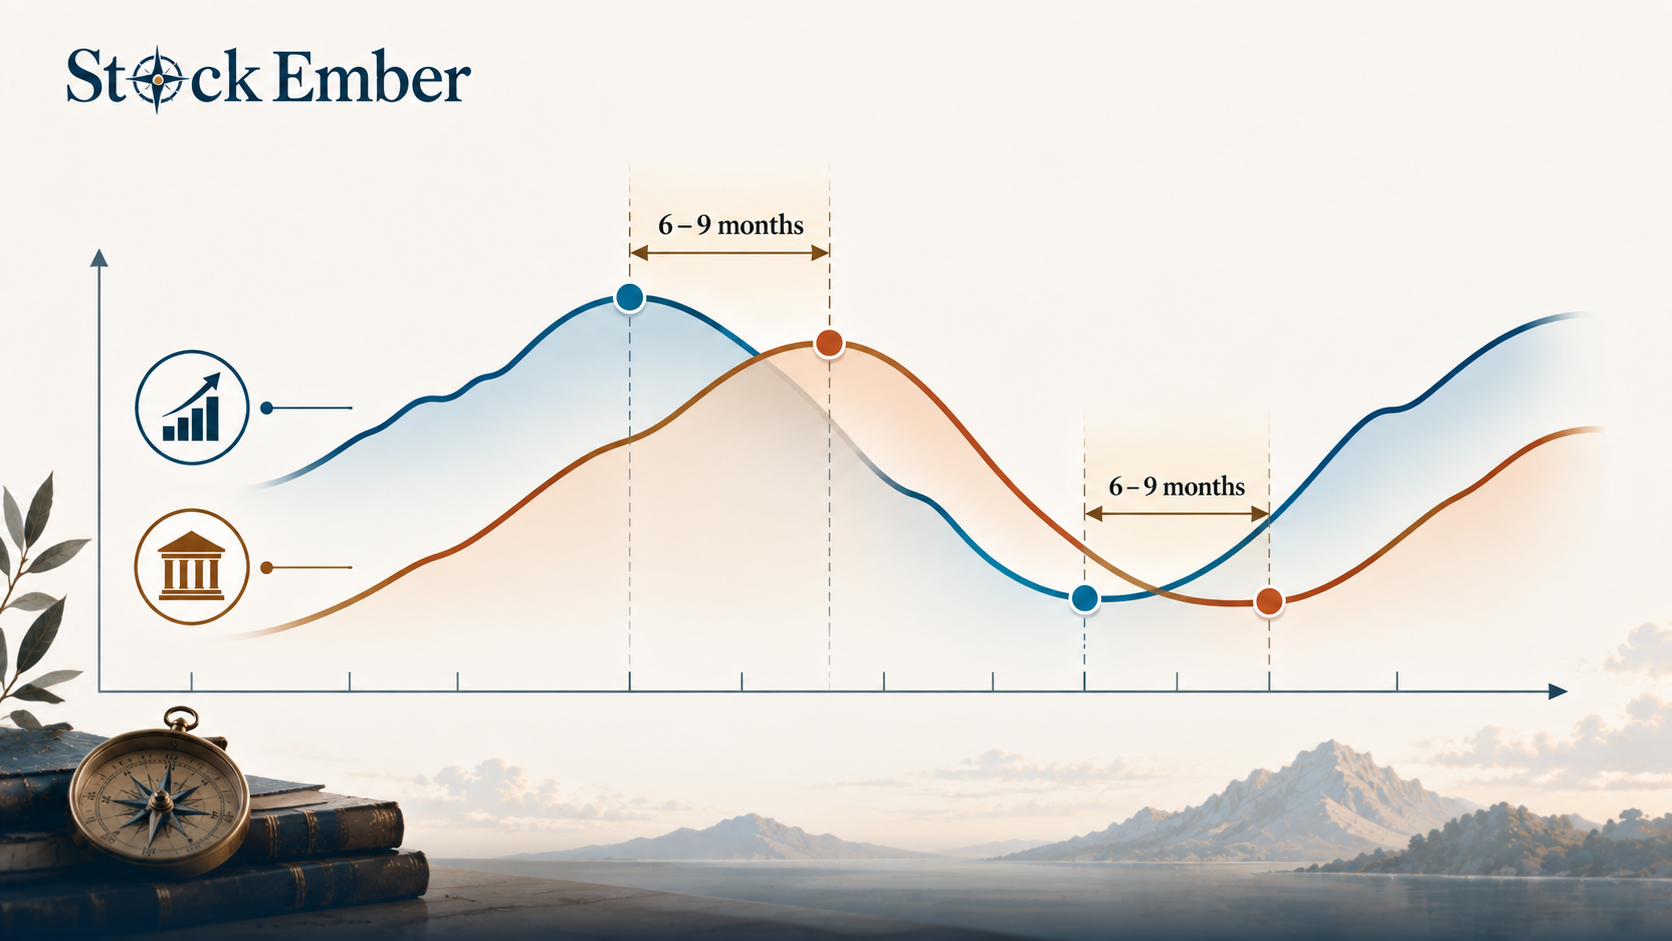
A common point of confusion is assuming that economic output and stock market prices move together in real time. In reality, stock markets regularly change direction six to nine months before economic data shifts. Stock prices reflect what investors expect companies to earn in the future, while GDP reports tell us what has already happened over the past quarter.
Feature
Economic Cycle
Stock Market Cycle
Definition
Measures overall fluctuations in national economic output
Reflects price movements and investor sentiment in equity markets
Data Used
Lagging metrics (e.g., Real GDP, unemployment rates)
Backward-looking (lags market shifts by 6 to 9 months)
Forward-looking (leads economic shifts by 6 to 9 months)
Practical Application
Evaluating macroeconomic health and historical trends
Managing portfolio risks and forward-looking asset allocation
Flow diagram showing the 6 to 9-month gap between lagging GDP data and leading stock market prices.
Because of this timing gap, stock markets often drop before a formal contraction appears in economic reports. Conversely, share prices often begin recovering while unemployment remains high and GDP numbers still look weak. Investors who wait for an economic cycle diagram to show a trough before buying often miss the initial stock market rally.
In practice, many long-term investors find that trying to match portfolio shifts to official GDP data leads to buying high near economic peaks and selling low during economic downturns.
Why the Long-Run Trend Line Matters for Portfolio Investors
The upward-sloping trend line in this chart shows that long-term progress persists despite short-term economic dips.
For long-horizon investors, the oscillating curve of peaks and troughs is less important than the steady incline of the baseline. Historical data shows that economic contractions are temporary interruptions within a much larger pattern of long-term expansion. Over ten-year holding periods, structural economic progress driven by population growth, technology, and business productivity tends to overcome cyclical downturns.
Focusing on the baseline helps investors handle a stock market correction without selling assets in a panic. When an economic contraction hits, short-term portfolio values may drop, but the underlying economy continues working toward its next recovery phase. Viewing economic pullbacks as standard features of the diagram prevents short-term fear from ruining long-term portfolio plans.
Common Mistakes: Why You Can't Time the Market with a Diagram
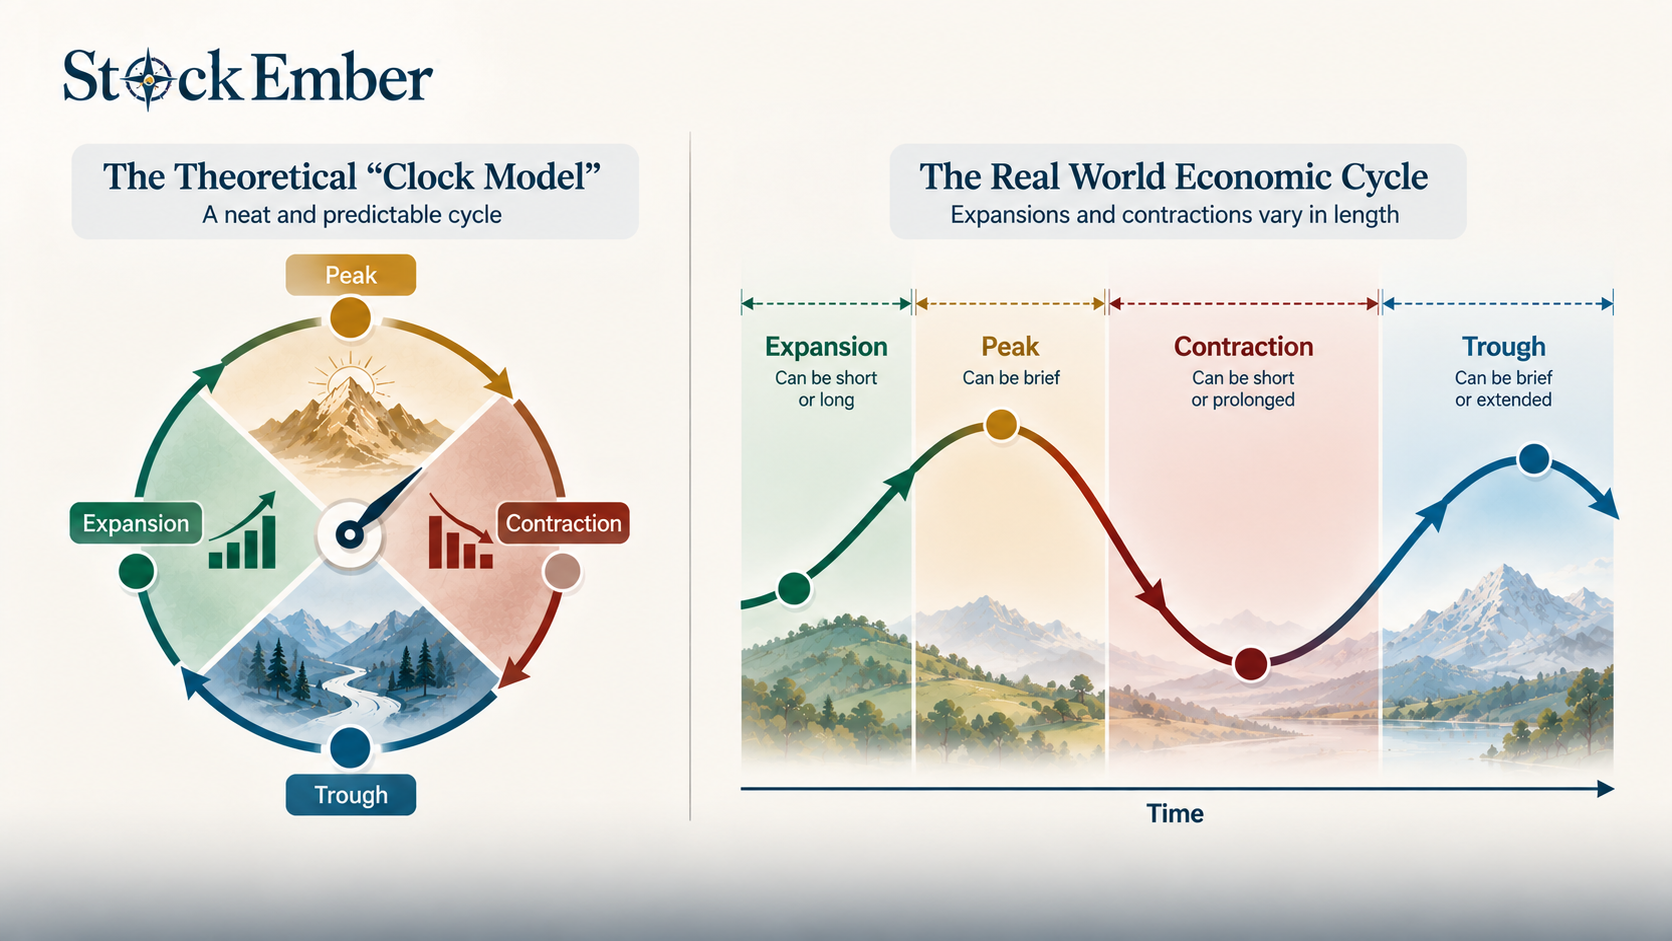
Attempting to time investment entry points using this model usually fails because economic cycles vary wildly in length and severity.
Diagram comparing the false fixed-length economic cycle model against real-world unpredictable cycle durations.
Three common traps mislead investors who try to use these diagrams as timing tools:
Treating the cycle like a clock: Real-world cycles do not follow rigid schedules. An expansion phase can last two years or extend past ten years.
High friction and tax costs: Shifting cash into defensive funds and back into growth stocks based on cycle guesses generates trading fees and taxable capital gains that erode total wealth over time.
Sitting in cash at the trough: Waiting for economic headlines to confirm a recovery means holding cash while asset prices are already rising, missing out on early recovery gains.
Long-term investors who stay fully invested across entire economic cycles generally perform better than those who attempt to jump in and out based on economic forecasts.
Conclusion
An economic cycle diagram is a useful tool for visual understanding, but it is not a formula for market timing.
Economic output moves through predictable phases of expansion, peak, contraction, and trough around a long-term potential growth line. Because stock prices change ahead of backward-looking economic reports, using GDP charts to trade stocks often leads to late decisions and missed returns.
Long-term investors who focus on the rising trend line can stay disciplined through temporary downturns without altering their investment strategies. When you are ready to build a resilient long-term portfolio across all economic phases, exploring our ETF reviews is a practical next step.
Investing always carries risk and past economic patterns do not guarantee future market behavior, so treat this guide as educational context rather than personal financial advice.
FAQ
5 questions
What are the 4 main phases of an economic cycle diagram?
An economic cycle diagram features expansion, peak, contraction, and trough. Expansion occurs when economic output grows; the peak is the maximum output before inflation pressures build; contraction represents slowing growth or recession; and the trough is the bottom of the slowdown before economic expansion begins again.
What does the long-run trend line represent in an economic cycle graph?
The long-run trend line represents an economy's potential GDP growth over time, driven by structural factors like population growth, technological advancement, and workforce productivity. It illustrates that short-term cyclical downturns do not derail the overarching upward trajectory of long-term economic expansion.
How does this model differ from a market cycle diagram?
This framework tracks past economic output using lagging metrics like Real GDP. In contrast, a market cycle diagram reflects forward-looking investor expectations regarding corporate earnings and interest rates. Consequently, according to research from the National Bureau of Economic Research (NBER), stock market asset prices usually lead macroeconomic output shifts by six to nine months.
Can you use an economic cycle diagram to time the stock market?
No. Using this chart for market timing is impractical because GDP numbers are backward-looking and released with delays. Real-world economic phases also vary unpredictably in duration, making exact timing difficult. Attempting to rotate portfolio holdings frequently based on cycle stages often creates unnecessary transaction costs and drag from taxes.
Why do stock prices bottom out before an economic trough occurs?
Stock markets operate as forward-looking valuation engines. Investors anticipate future business earnings improvements long before official economic statistics reflect positive growth. As a result, equity prices often rally during the late stages of a contraction, well before GDP data officially confirms an economic trough.
Disclaimer
This guide was written with AI assistance and reviewed by the StockEmber editorial team for accuracy. StockEmber provides independent education, not personal financial advice. Investing puts your capital at risk: the value of investments can go down as well as up, you may get back less than you invest, and past performance doesn’t guarantee future results. Some links may support our work at no additional cost to you.
The StockEmber Team is our in-house desk of independent research writers. We test brokerage platforms, read the fine print on fees and custody, and cover ETFs and long-horizon investing for people who plan to hold for decades — not days.