The beta of a stock is a financial calculation that measures how much a share's price moves relative to a market benchmark index like the S&P 500. A beta value above 1.0 indicates greater price swings than the index, while a score below 1.0 reflects smaller relative movements. It highlights historical systematic market risk rather than company-specific operational quality.
The beta of a stock measures how much its price moves relative to a benchmark market index, such as the S&P 500. It shows historical sensitivity to broad market swings rather than total business quality or balance sheet strength.
If you see an equity with a beta of 1.5, you might wonder whether that extra movement helps or hurts your long-term wealth. Understanding this metric helps buy-and-hold investors set realistic expectations for portfolio drawdowns without mistaking price volatility for corporate safety. This guide breaks down how beta works, how calculation timeframes alter the number, and why a low score cannot protect against company-specific business failures.
Quick Takeaways
01The beta of a stock measures price movements relative to a benchmark index set at 1.0.
02A beta above 1.0 signals greater historical volatility than the market, while a score below 1.0 indicates smaller swings.
03Beta reflects past systematic market risk, not future performance or individual business quality.
04Lookback periods like 3-year or 5-year data windows can yield different beta values for the exact same asset.
05Combining low-beta assets can smooth portfolio swings, but it does not eliminate company-specific downside.
What Is the Beta of a Stock?
The beta of a stock is a statistical calculation that compares an equity's historical price fluctuations against a broader market benchmark. In stock market analysis, the benchmark index, most commonly the S&P 500 for US equities, is assigned a benchmark beta value of 1.0.
For investors who practice passive investing through broad market funds, the benchmark index represents baseline market risk. Beta measures how strongly an individual share reacts when that overall market moves up or down. If a stock moves in the exact same direction and percentage magnitude as the index, its beta is 1.0.
It is essential to clarify what beta does not measure. Beta is not a rating of a company's earnings, management quality, or financial health. A company with high debt and falling revenues might happen to have a low beta during a quiet market stretch, while a fast-growing, highly profitable business might carry a high beta simply because investors trade its shares actively. Beta measures relative price sensitivity, not business safety.
How Stock Beta Is Measured (and What the Numbers Mean)
Stock beta is calculated by dividing the covariance of a stock's returns and market returns by the variance of market returns over a specific timeframe.
In simple terms, covariance tracks how the stock and the market move together, while variance measures how far market returns spread out from their average. Financial platforms run this math automatically, assigning every public equity a numerical beta score:
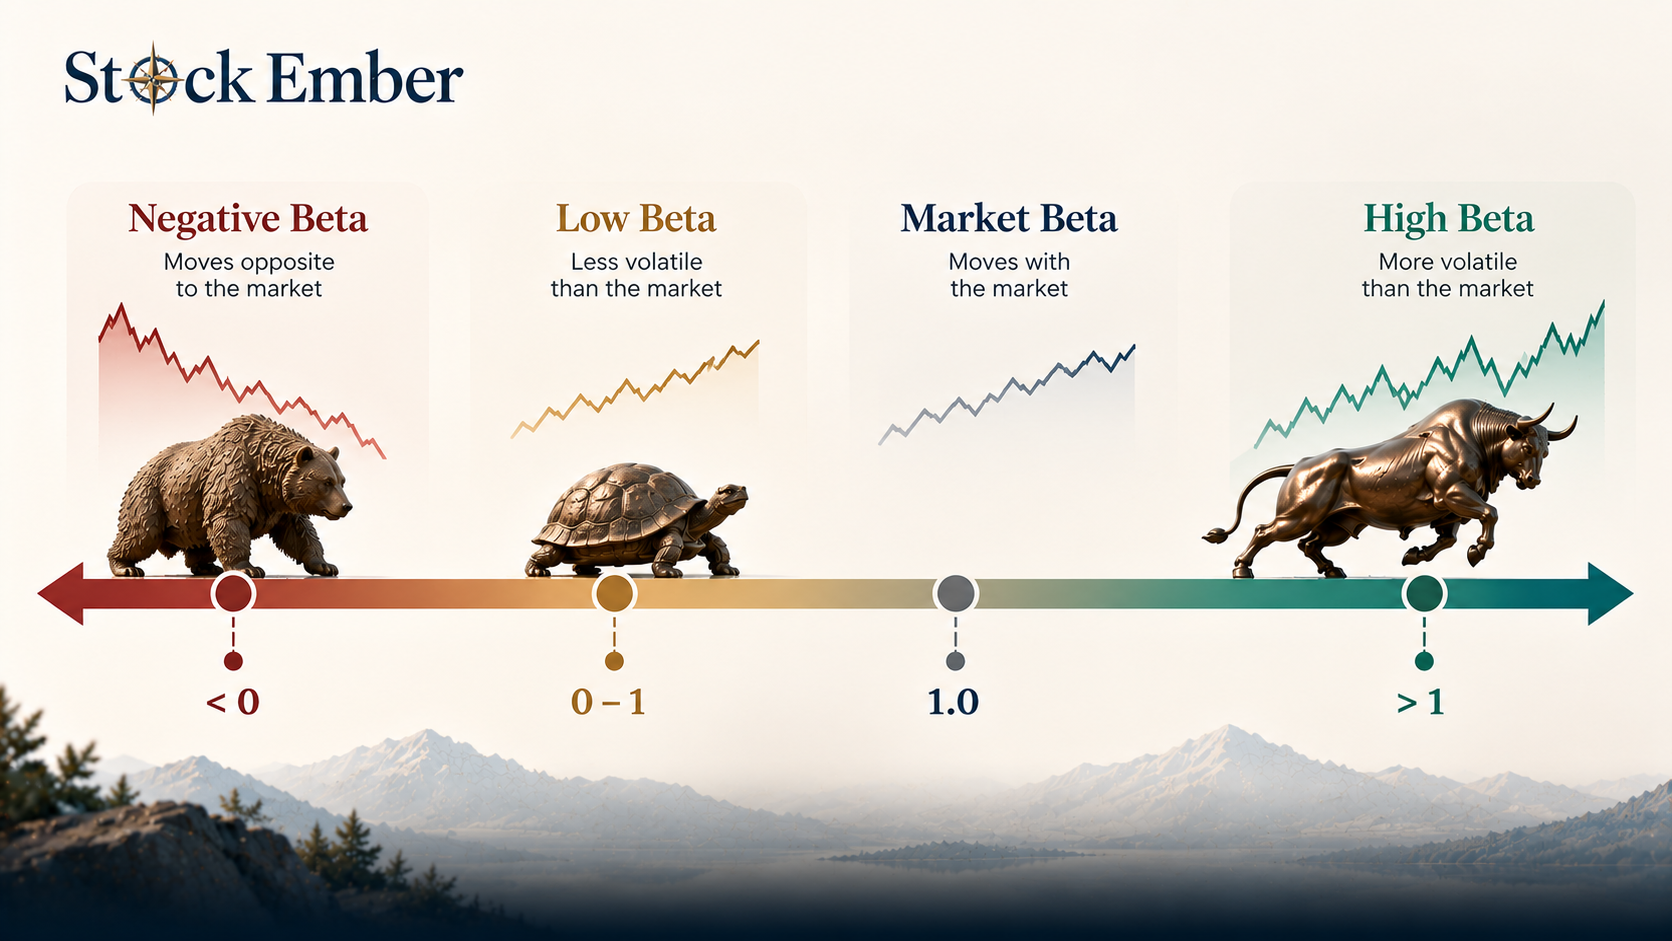
High Beta (> 1.0): The stock swings more than the benchmark. A beta of 1.5 means that if the index rises by 10%, the stock historically rises by 15%. However, if the market falls by 10%, the stock drops by 15%.
Benchmark Beta (= 1.0): The stock moves in close alignment with the market index in both direction and percentage size.
Low Beta (0 to 1.0): The stock swings less than the benchmark. A beta of 0.6 means that if the index drops by 10%, the stock historically fell by only 6%.
Zero Beta (= 0): The asset's price movements have no statistical correlation with the stock market index. Cash holdings and short-term Treasury bills usually sit near zero.
Negative Beta (< 0): The stock moves in the opposite direction of the market index. If the market falls, a negative beta asset historically gains value.
Diagram illustrating stock beta values from low to high relative to a market benchmark.
The actual beta value you see on financial websites depends on the data lookback window used in standard institutional practice. A 3-year monthly beta looks at 36 data points, while a 5-year monthly beta evaluates 60 points. Because company business models and broader economic conditions change over time, the exact same stock can show a 3-year beta of 1.2 and a 5-year beta of 0.9.
Why Beta Matters for Long-Term Portfolio Construction
Long-term investors use stock beta to anticipate how a portfolio reacts during severe market downturns. Knowing the relative sensitivity of your holdings helps you build a portfolio aligned with your personal risk tolerance.
If your portfolio consists entirely of high-beta tech stocks, a general market pullback of 20% could translate into a 30% or 35% decline in your account balance. For many buy-and-hold investors, experiencing deep drawdowns triggers emotional stress that leads to selling at market bottoms. Adding lower-beta holdings, such as utility companies or consumer staples, can reduce total portfolio volatility, making market downturns easier to endure.
Evaluating relative volatility alongside risk-adjusted metrics like the Sharpe ratio allows investors to check whether taking on extra price swings actually yielded higher long-term returns.
In practice, many long-term investors find that holding low-beta shares helps them stay committed to their plan during bear markets, preventing panic selling when index prices drop sharply.
Market Risk vs. Unsystematic Risk: Where Beta Misleads
A common mistake is assuming a low-beta stock is naturally safe. Beta measures systematic risk, the broad market risk that affects all companies, such as interest rate changes, inflation, or recessions. However, beta completely ignores unsystematic risk, which is the specific business risk tied to an individual firm.
Feature
Systematic Risk
Unsystematic Risk
Definition
Broad economic market movements
Company or industry-specific events
Examples
Interest rate shifts, inflation, recessions
Product recalls, poor management, fraud
Measured by Beta?
Yes
No
Impact of Diversification
Cannot be eliminated by diversification
Can be reduced through diversification
A utility stock might show a low beta of 0.4 because its stock price does not react heavily to daily market headlines. Yet, if that specific utility faces operational failure or regulatory fines, its share price can fall drastically regardless of how well the broad market performs.
Official guidance from the US SEC emphasizes that market risk and individual asset risk require distinct evaluation. A low beta stock is not risk-free.
Common Pitfalls When Relying on Stock Beta
Relying solely on historical beta to judge investment safety creates several blind spots for long-term holders:
Assuming Past Sensitivity Guarantees Future Movement: Beta is calculated from backward-looking historical data. A company that maintained a low beta during a stable economic cycle may experience sharp price swings if its business model shifts or debt levels rise.
Confusing Price Volatility with Business Quality: A low-beta company is not automatically a well-managed business. It simply means the stock's market price traded with lower relative swings over the lookback period.
Ignoring Time Horizons: Short-term traders pay close attention to daily beta. Long-term buy-and-hold investors who keep assets for ten years or more often find that corporate earnings growth and dividend sustainability matter far more than short-term beta scores.
Conclusion
The beta of a stock provides a helpful benchmark for understanding how an individual investment moves relative to the broader market. However, price sensitivity is only one aspect of risk, as it ignores internal financial health and company-specific business performance. Using beta alongside fundamental analysis gives buy-and-hold investors a clearer view of relative portfolio swings.
When you're ready to choose broad funds that match your risk tolerance, our ETF reviews are the place to start. Investing always puts your capital at risk and past returns never promise future performance, so use this statistical metric as an educational guide rather than financial advice.
FAQ
5 questions
What does a beta of 1.5 mean for a stock?
A beta of 1.5 means the stock is historically 50% more volatile than the broad market benchmark. If the market index rises by 10%, the stock's price historically increases by 15%. Conversely, if the market declines by 10%, the stock is expected to fall by 15%.
Is a lower stock beta safer for long-term investors?
A lower beta indicates smaller historical price swings relative to the market, which can smooth out short-term portfolio drawdowns. However, low beta does not mean zero risk. A stock with a low beta can still experience sharp losses due to company-specific bad news, poor management, or weak earnings performance.
Can a stock have a negative beta?
Yes, a stock or asset can have a negative beta, meaning its price historically moves in the opposite direction of the market index. When broad equity markets decline, a negative-beta asset tends to gain value. Assets like gold or inverse investment funds sometimes exhibit negative or near-zero correlation with major equity indexes.
What is the difference between beta and volatility?
Standard volatility measures how widely a stock's price fluctuates on its own, regardless of what the broader market is doing. Beta specifically measures relative volatility compared to a benchmark market index like the S&P 500. A stock can have high individual price volatility but a moderate beta if its swings do not correlate with market movements.
Does beta measure company-specific risk?
No, beta only measures systematic risk, which is broad market sensitivity caused by macroeconomic factors such as inflation or interest rate shifts. It ignores unsystematic risk, which includes company-specific factors like debt levels, management decisions, or product failures. A stock with low market beta can still suffer severe financial losses.
Disclaimer
This guide was written with AI assistance and reviewed by the StockEmber editorial team for accuracy. StockEmber provides independent education, not personal financial advice. Investing puts your capital at risk: the value of investments can go down as well as up, you may get back less than you invest, and past performance doesn’t guarantee future results. Some links may support our work at no additional cost to you.
The StockEmber Team is our in-house desk of independent research writers. We test brokerage platforms, read the fine print on fees and custody, and cover ETFs and long-horizon investing for people who plan to hold for decades — not days.