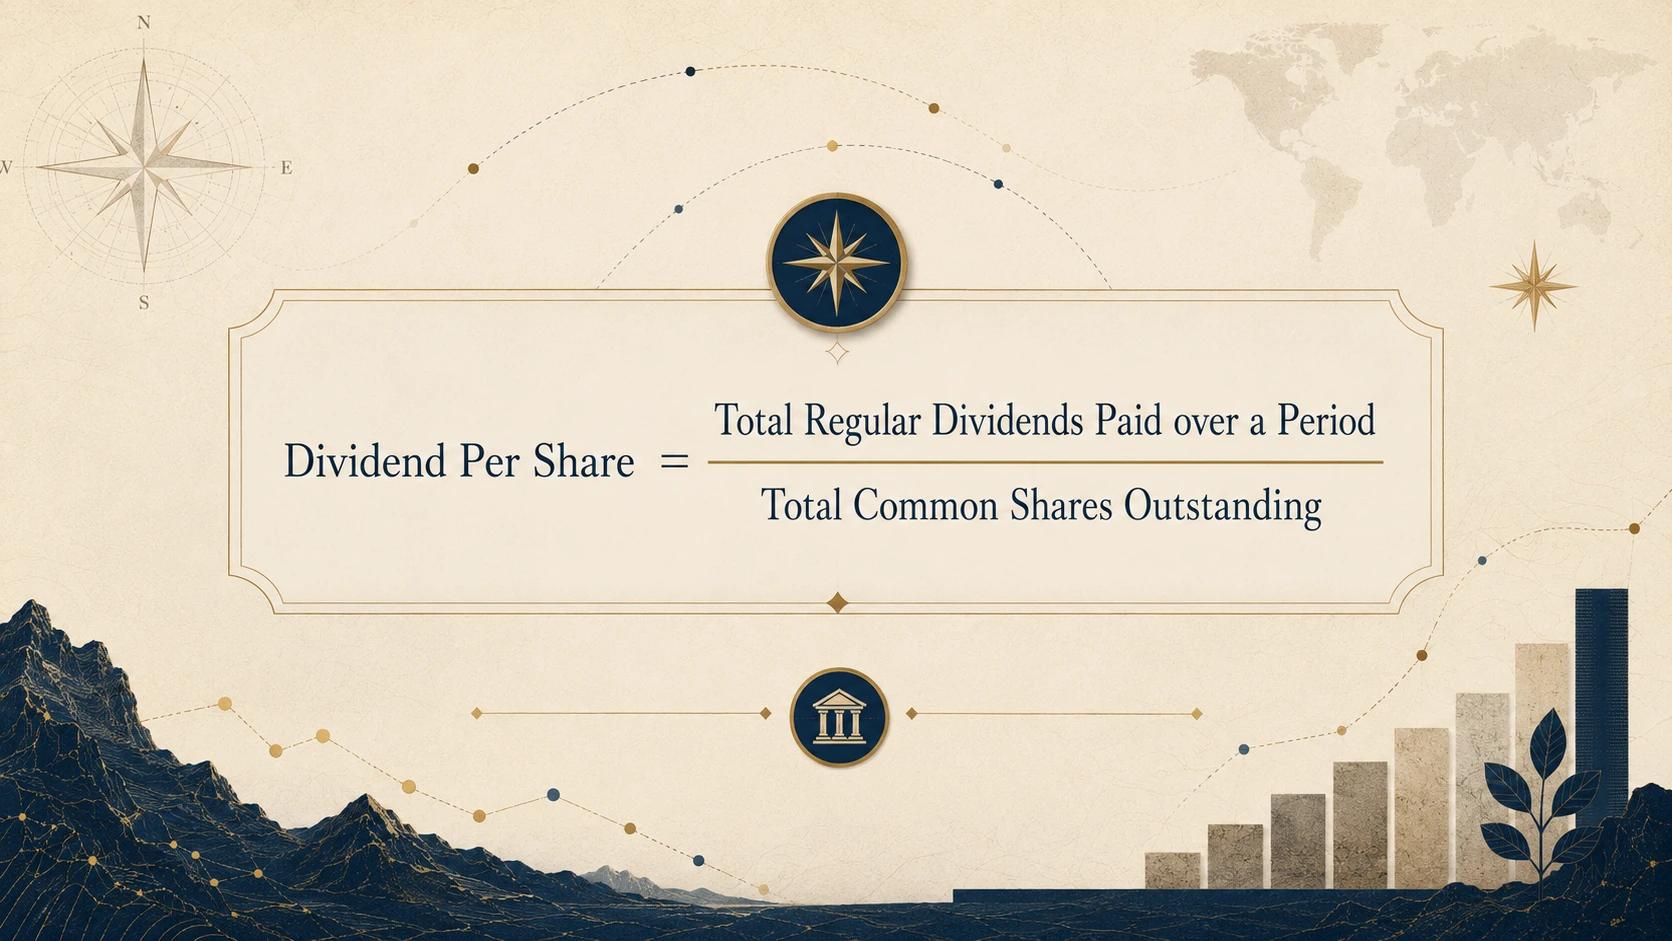
Dividend per share (DPS) is the total dollar amount of regular common dividends distributed by a company for each individual outstanding share over a specific timeframe, usually one year. It is calculated by dividing total regular common dividend payouts by the total number of common shares outstanding. The metric reflects historical board allocations and carries no legal obligation for future corporate payouts.
Dividend per share (DPS) is the total amount of regular dividends declared by a company for every individual outstanding share of common stock over a specific period, typically one year. It represents the direct cash return a corporation distributes to its baseline equity owners.
For long-horizon, buy-and-hold investors, tracking this metric helps clarify how efficiently a company distributes cash relative to its total equity base. However, while analyzing historical distribution metrics can offer insights into a single firm's corporate maturity, relying on single-stock calculations requires a different approach if your goal is maintaining a broad, passive index portfolio. This guide breaks down how the metric functions, how to calculate it, and how to look past the numbers to avoid common yield traps.
Quick Takeaways
01Direct Payout Metric: Dividend per share shows the exact dollar amount distributed to an investor for each individual share held over a specific financial timeframe.
02Historical Data Point: The metric reflects past board allocations and carries no legal obligation or guarantee for future payouts.
03The Growth Balance: While rising distributions can signal corporate stability, outsized metrics can sometimes mask underlying stock price collapses or unsustainable capital depletion.
What Is Dividend Per Share?
Dividend per share is the net amount of cash a corporation gives back to holders of its common stock on a per-share basis. When a company generates a profit, its board of directors chooses between two paths: keeping the profits as retained earnings to fund future corporate operations, or distributing a portion of that cash directly to shareholders as a dividend.
To analyze these payouts accurately, market participants look at the metric through two primary lenses:
Trailing DPS: The sum of all regular dividends actually paid out over the previous 12 months. This is a matter of historical accounting fact.
Forward DPS: An estimated projection of the coming year's payout, calculated by taking the company's most recent quarterly or semi-annual dividend and annualizing it.
Because dividend payments are entirely discretionary and governed by a board of directors rather than a fixed debt contract, these figures can change without warning. A company is never legally obligated to maintain its past payout velocity.
The Dividend Per Share Formula
The dividend per share formula is calculated by dividing the total amount of regular cash dividends declared over a specific timeframe by the total number of outstanding common shares.
The baseline equation is structured as follows:
Dividend per share formula
To calculate this properly, special or one-time auxiliary dividends are typically excluded because they do not reflect the predictable, recurring distribution power of the underlying business. Additionally, preferred dividends are subtracted from the total dividend pool, as preferred shareholders sit higher in the capital allocation structure than common stock owners.
To see the dividend per share formula in practice, consider a hypothetical corporate example. Suppose a business generates strong cash flow and declares a total annual common dividend pool of $10,000,000. If the company has 5,000,000 common shares outstanding among its investors, the calculation would be:
Example of Dividend per share
In this scenario, an investor holding 100 shares of common stock would receive a total cash distribution of $200 for the year.
Why Dividend Per Share Matters for Long-Term Investors
For a patient buy-and-hold investor, tracking steady, incremental growth in this metric can serve as a proxy for structural corporate health. Consistent distribution increases demonstrate that a firm is generating real, recurring free cash flow rather than relying on paper accounting profits. Over a long-term holding period, investors often look to a structured dividend growth model to estimate how a rising corporate distribution trend impacts the theoretical value of their equity assets over time.
However, distributing cash introduces a significant corporate trade-off. Every dollar a board pays out to shareholders is a dollar removed from the company's balance sheet. That capital cannot be used to fund research and development, build new infrastructure, pay down long-term corporate debt, or execute stock buybacks.
Over a 10-year investment horizon, this allocation choice shifts your compounding trajectory. A company that retains its earnings to compound internally at a high rate of return may deliver substantially greater capital appreciation over a decade, whereas a high-distribution firm trades that internal compounding for immediate cash payouts.
Common Mistakes: The Yield Chasing Trap
The most frequent behavioral pitfall for individual stock investors is confusing a high historical dividend per share metric with absolute portfolio safety. This cognitive vulnerability frequently leads to "yield chasing," where an investor buys a stock purely for its trailing distribution size.
This problem becomes clear when looking at a collapsing stock price. Because dividend yield is calculated by dividing the annual distribution by the current market share price, a steep drop in a company's stock price will cause its trailing yield to spike artificially. If the underlying business is structurally compromised, the board will eventually be forced to cut or suspend the distribution entirely, turning a perceived income haven into a classic value trap.
The Passive Investor’s Viewpoint
If you build your portfolio around broad-market index funds or diversified exchange-traded funds (ETFs), analyzing individual corporate distributions becomes largely unnecessary. A passive, long-term strategy automatically bypasses the need to track single-stock metrics on a daily or monthly basis.
When you buy a diversified index product, you hold a fractional share of hundreds of distinct corporations simultaneously. The individual dividend choices of any single corporate board do not dictate your portfolio's survival. If one company suffers an operational decline and cuts its distribution, the impact is minimized by the positive cash flows and capital growth of the remaining firms within the index basket. A passive portfolio structurally captures aggregate global corporate distributions while protecting your wealth from the operational vulnerabilities of individual corporate balance sheets.
Conclusion
Dividend per share serves as a fundamental financial tool for measuring how much direct cash a corporation distributes to its common equity owners. Calculating it using the standard formula offers a clear view of historical corporate distribution preferences. However, long-horizon investors must remember that historical metrics carry no future guarantees, and prioritizing high distributions blindly can expose a portfolio to hidden structural risks and value traps.
For those executing a patient, buy-and-hold strategy, individual stock tracking is generally secondary to maintaining a low-cost asset allocation. Evaluating broad, diversified fund options is often the most reliable path to achieving balanced long-term returns. When you are ready to evaluate diversified index implementations across the global markets, reading our independent ETF reviews is a practical next step to guide your allocation strategy.
FAQ
4 questions
How do you calculate total dividend income using Dividend Per Share?
Multiply the Dividend Per Share (DPS) amount by the total number of shares you hold in the company. For example, holding 100 shares of a stock with a $2.00 DPS yields $200 in total annual dividend income.
Does a stock split change the Dividend Per Share amount paid by a company?
Yes. During a stock split, the Dividend Per Share is adjusted downward in exact proportion to the split ratio so that total dividend cash payouts to existing shareholders remain identical post-split.
Where can investors locate a company's historical Dividend Per Share payouts?
Investors can find historical DPS figures in the investor relations section of a company's website, quarterly Form 10-Q and annual 10-K SEC filings, or on financial market data websites.
What is the relationship between Dividend Per Share and dividend yield?
Dividend Per Share is the absolute dollar value paid per share annually. Dividend yield expresses that dollar payout as a percentage of the current share price (DPS / Share Price).
Disclaimer
This guide was written with AI assistance and reviewed by the StockEmber editorial team for accuracy. StockEmber provides independent education, not personal financial advice. Some links may support our work at no additional cost to you.
The StockEmber Team is our in-house desk of independent research writers. We test brokerage platforms, read the fine print on fees and custody, and cover ETFs and long-horizon investing for people who plan to hold for decades — not days.