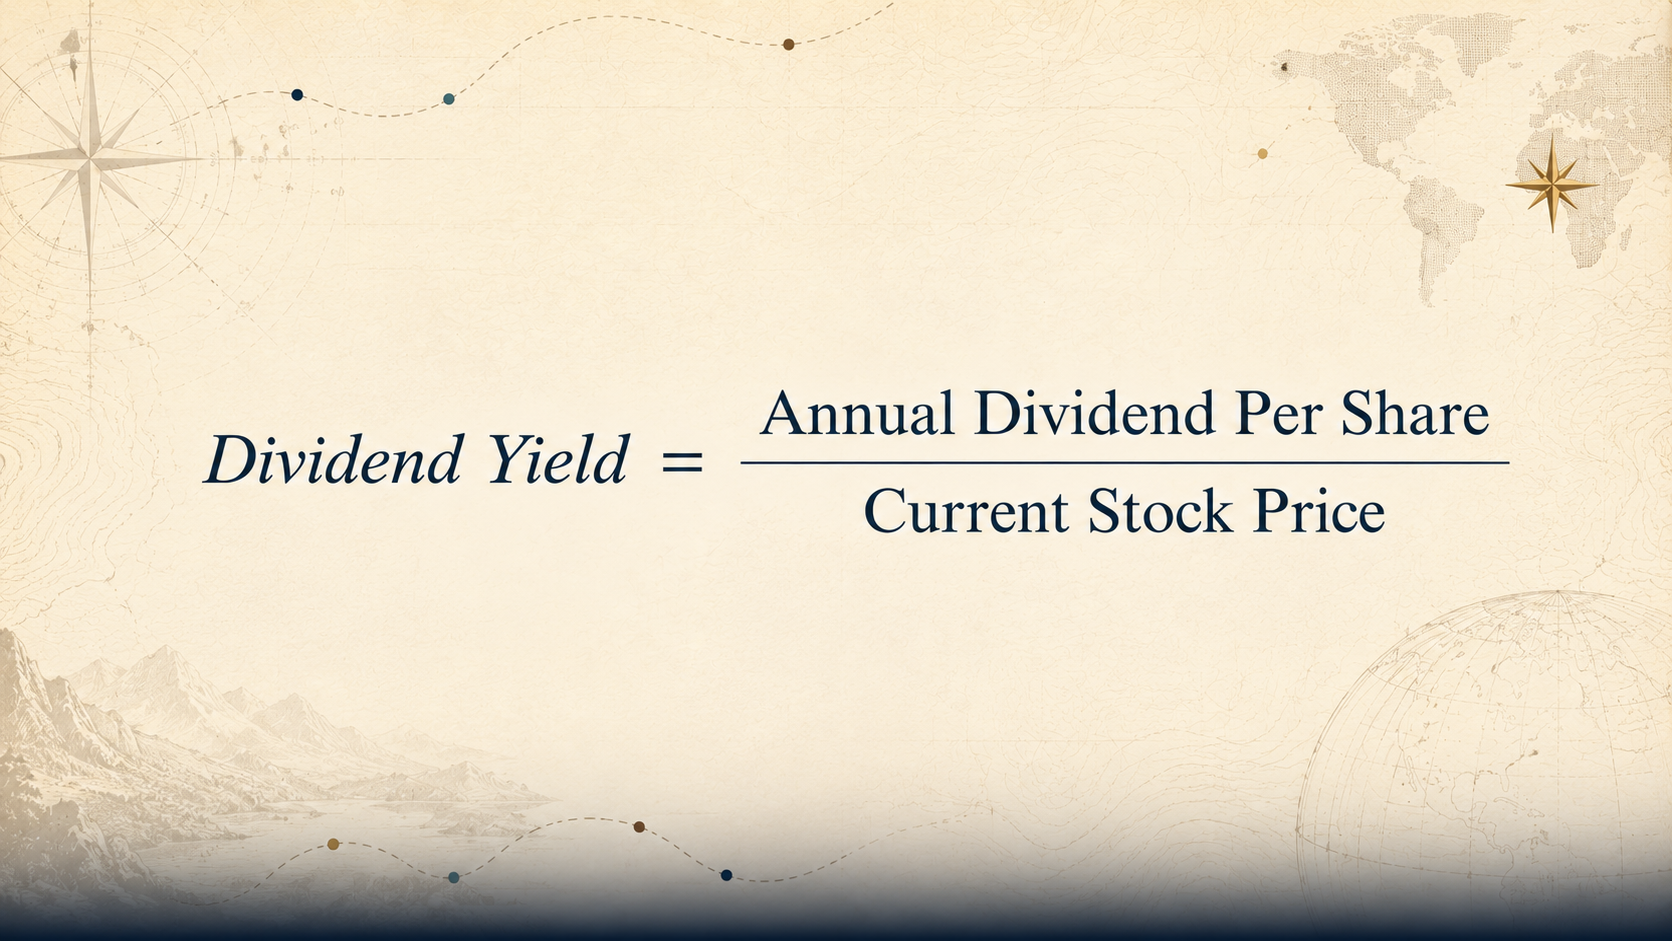
A dividend yield is a financial ratio that measures the annual cash dividends paid by a company relative to its current stock price, expressed as a percentage. It is calculated by dividing the annual dividend per share by the current share market value. Because it relies on the stock price as its denominator, the percentage changes constantly as market prices fluctuate.
A dividend yield is a financial ratio that shows how much a company pays out in dividends each year relative to its current share price, expressed as a percentage. It represents the annual cash return an investor earns on a stock based on its prevailing market value.
For long-horizon investors, understanding this metric is essential for evaluating cash flow against capital appreciation. However, evaluating a dividend yield in a vacuum can be a deceptive exercise if you do not understand how price movements distort it. This guide covers how dividend yield operates, its practical application in a buy-and-hold strategy, and the critical structural differences between a strong yield and an income trap.
Quick Takeaways
01The dividend yield is a moving variable that changes constantly with a stock's market price, even if the absolute cash payout remains unchanged.
02A high dividend yield is not an automatic signal of strength; it often indicates a collapsing stock price caused by deteriorating business fundamentals.
03Long-term wealth generation relies on total return—the combination of cash yields and capital growth—rather than prioritizing yield percentage alone.
04Sector variations mean mature industries naturally maintain higher baseline yields, while growth companies favor reinvesting profits over paying cash distributions.
How a Dividend Yield Works
To answer what is a dividend yield in numbers, you divide a company's total annual dividend payments per share by its current stock price.
Dividend yield formula
Because the current share price serves as the denominator in this formula, the resulting yield percentage moves inversely to the market. If a business distributes an annual cash payout of $2 per share while its stock trades at $50, the math produces a 4% dividend yield. If market sentiment shifts and the share price declines to $40 while the cash distribution is maintained, the metric adjusts upward to 5%. Conversely, if the stock rises to $100, the yield compresses down to 2%.
Understanding this calculation reveals that the percentage metric reflects relative valuation rather than absolute corporate wealth generation. For the regulator's plain-English definition of a dividend, seeInvestor.gov, the investor education site of the U.S. Securities and Exchange Commission.
Yield vs. Payout Ratio: The Essential Difference
Many investors stepping into what are dividend stocks confuse the dividend yield with the dividend payout ratio. They measure entirely different aspects of a corporate distribution.
While the dividend yield tells you what you receive in cash relative to the stock's current market price, the payout ratio tells you what the company distributes relative to its net earnings. If a company earns $4 per share and hands out $2 to investors, its payout ratio is 50%.
Metric
What It Measures
What It Tells You
Dividend Yield
Annual dividend ÷ current stock price
The cash return you receive relative to today's market price
Payout Ratio
Annual dividend ÷ net earnings per share
Whether the company can sustain its dividend over time
A long-term investor uses the payout ratio to judge whether a dividend yield is sustainable over a decade. A yield can look exceptionally generous on paper, but if the payout ratio exceeds 80% or 90%, the company is retaining very little cash to maintain operations, pay down corporate debt, or weather economic downturns.
Why Dividend Yield Matters for Long-Term Investors
For a patient, buy-and-hold portfolio, the dividend yield acts as a primary baseline for cash generation. When you know what is a dividend(→ /what-is-a-dividend) structurally, you know it represents cold cash returning to your account. This cash gives you flexible options for spending or reinvesting, without forcing you to sell (liquidate) any of the shares you own.
Over extended timelines, these cash distributions play a major role in amplifying returns. When these regular payouts are fed directly back into your portfolio to buy more asset shares, you unleash the engine of compound interest.
In practice, relying purely on the current yield to project future wealth can create portfolio imbalances. True compounding power is generated when a sustainable yield is paired with a business capable of expanding its underlying equity value over time.
Evaluating the Metric Over a Ten-Year Horizon
For an investor focused on multi-year time horizons, analyzing yields requires looking at how these distributions compound over time. A common error is viewing a regular cash payout in isolation, without factoring in how corporate costs and market adjustments alter your final return over a decade.
When a company pays out cash, that capital leaves its balance sheet, lowering the intrinsic value — the underlying worth — of the business. If a fund or stock offers a high current yield but its underlying asset value erodes by a tiny margin every year, the structural drag accumulates quietly.
A minor annual cost drag or capital loss doesn't look like much in a single quarter. But if you hold that position across 10 years, that steady erosion can quietly swallow up a significant portion of your total investment value—money that would have otherwise compounded cleanly. Real wealth building requires balancing the cash you receive today against the long-term health of your capital.
In practice, a modest but growing yield can prove more sustainable than the highest nominal percentage on day one, though outcomes vary with market conditions and each investor's circumstances. A stable payout leaves the underlying corporate equity intact to grow over a decade.
The High-Yield Trap: When a High Percentage Is a Warning
A sharp spike in a metric does not automatically mean a company has become a more generous distributor of profits. Because the calculation uses the current market valuation as its base, a crashing stock price causes the yield percentage to climb rapidly.
This scenario is known as a dividend trap. If a company faces severe structural disruption, institutional market participants will sell the stock, forcing the share price down. If a $40 stock paying a $2 dividend drops to $20 due to poor business health, its calculated yield instantly doubles from 5% to 10%.
Chasing this raw 10% figure introduces severe capital risks:
Imminent Payout Cuts: Companies facing distress rarely maintain their historical cash distributions for long.
Capital Loss: The income gained from the distribution is easily wiped out by the drop in the core asset value.
Long-horizon participants must verify that a yield is supported by healthy corporate earnings rather than a collapsing stock price.
Yield vs. Total Return
When constructing a patient portfolio, your final performance is dictated by total return—the combination of cash distributions and capital appreciation. A stock with a modest 2% yield whose underlying value grows steadily over a decade will often outperform a stagnant business offering a 7% yield that fails to grow.
If your primary focus centers on broad market vehicles, understanding what are dividend stocks helps clarify how equity distributions function. However, analyzing individual corporate payout ratios is not the only route available. For some investors, holding broad index funds is one way to capture the blended yield of the entire market automatically, reducing single-company risk — though whether this approach fits depends on your own goals, time horizon, and risk tolerance.
Conclusion
So, what is a dividend yield in day-to-day practice? It is a useful tool for measuring the regular cash flow generated by your investments relative to their current market price. However, a high nominal percentage should never be evaluated blindly; it must always be supported by steady earnings and a resilient corporate baseline.
True financial progress is achieved by looking past short-term cash metrics and focusing on total portfolio return over time. If you want to compare vehicles for holding long-term assets and tracking these returns, our exchange-traded fund (ETF) reviews offer a starting point for further research.
FAQ
3 questions
Is a higher dividend yield always better?
Not necessarily. A very high dividend yield can be a warning sign, often known as a "dividend trap," where a falling stock price artificially inflates the percentage. Always investigate if the high yield is due to a strong business or a declining asset value.
What is a dividend yield and how is it calculated?
You calculate the dividend yield by dividing the annual dividend payment per share by the stock's current market price. For example, a $2 annual dividend on a $50 stock results in a 4% yield.
What is the difference between dividend yield and dividend payout ratio?
The dividend yield measures the cash return relative to the stock price, helping you see your immediate income. The payout ratio measures what percentage of a company's total net earnings it pays out to shareholders, which helps you judge the sustainability of those dividends.
Disclaimer
This guide was written with AI assistance and reviewed by the StockEmber editorial team for accuracy. StockEmber provides independent education, not personal financial advice. Some links may support our work at no additional cost to you.
The StockEmber Team is our in-house desk of independent research writers. We test brokerage platforms, read the fine print on fees and custody, and cover ETFs and long-horizon investing for people who plan to hold for decades — not days.