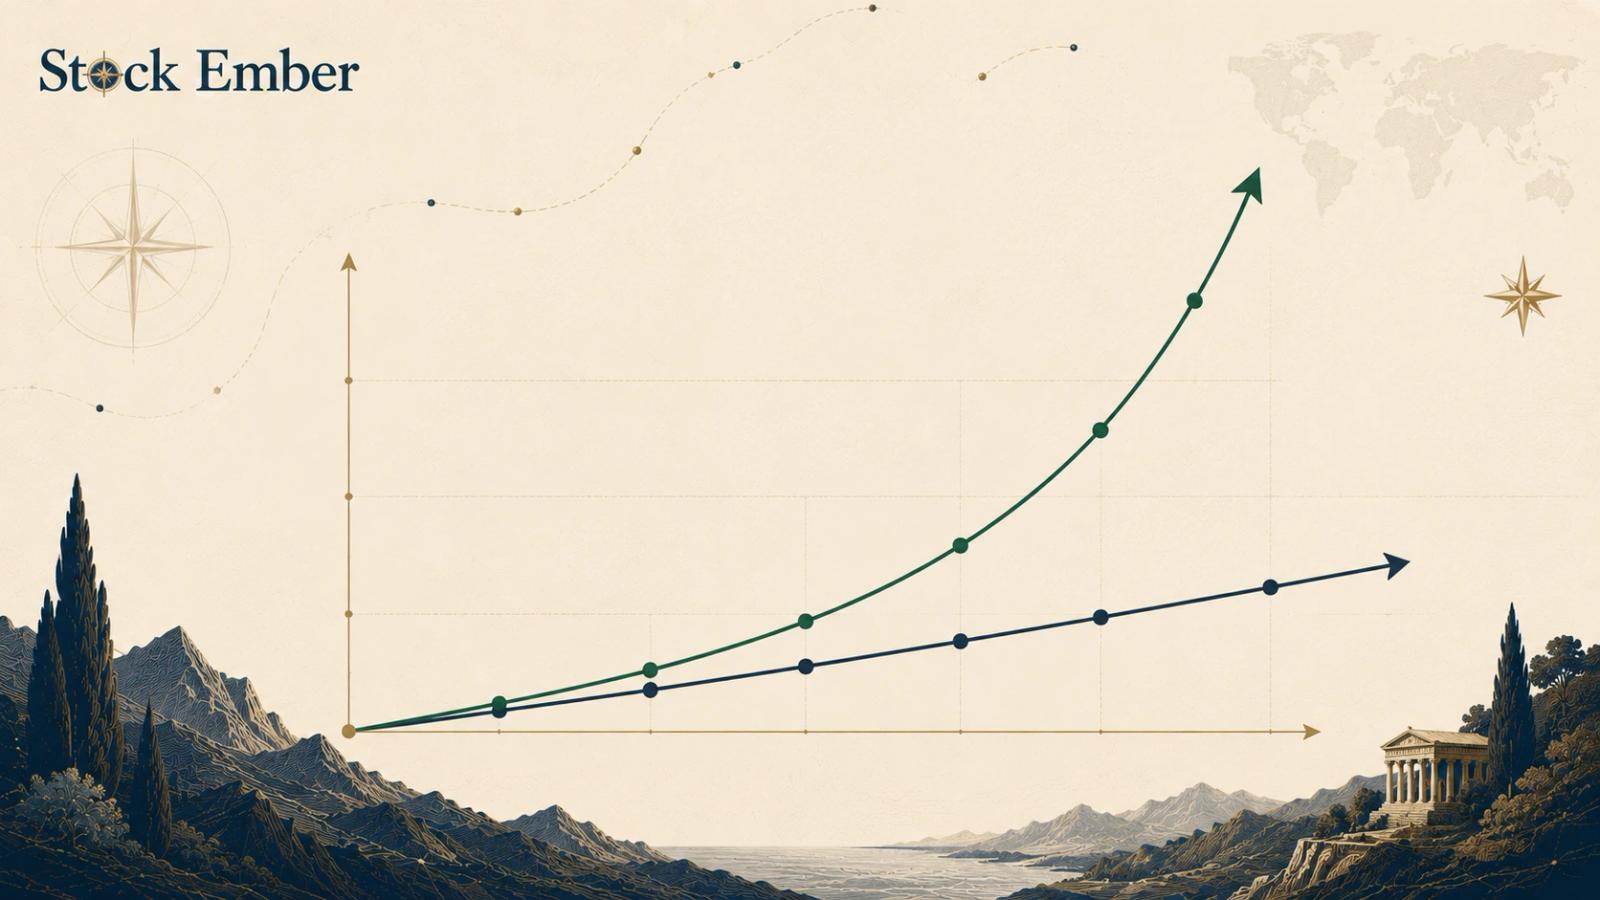
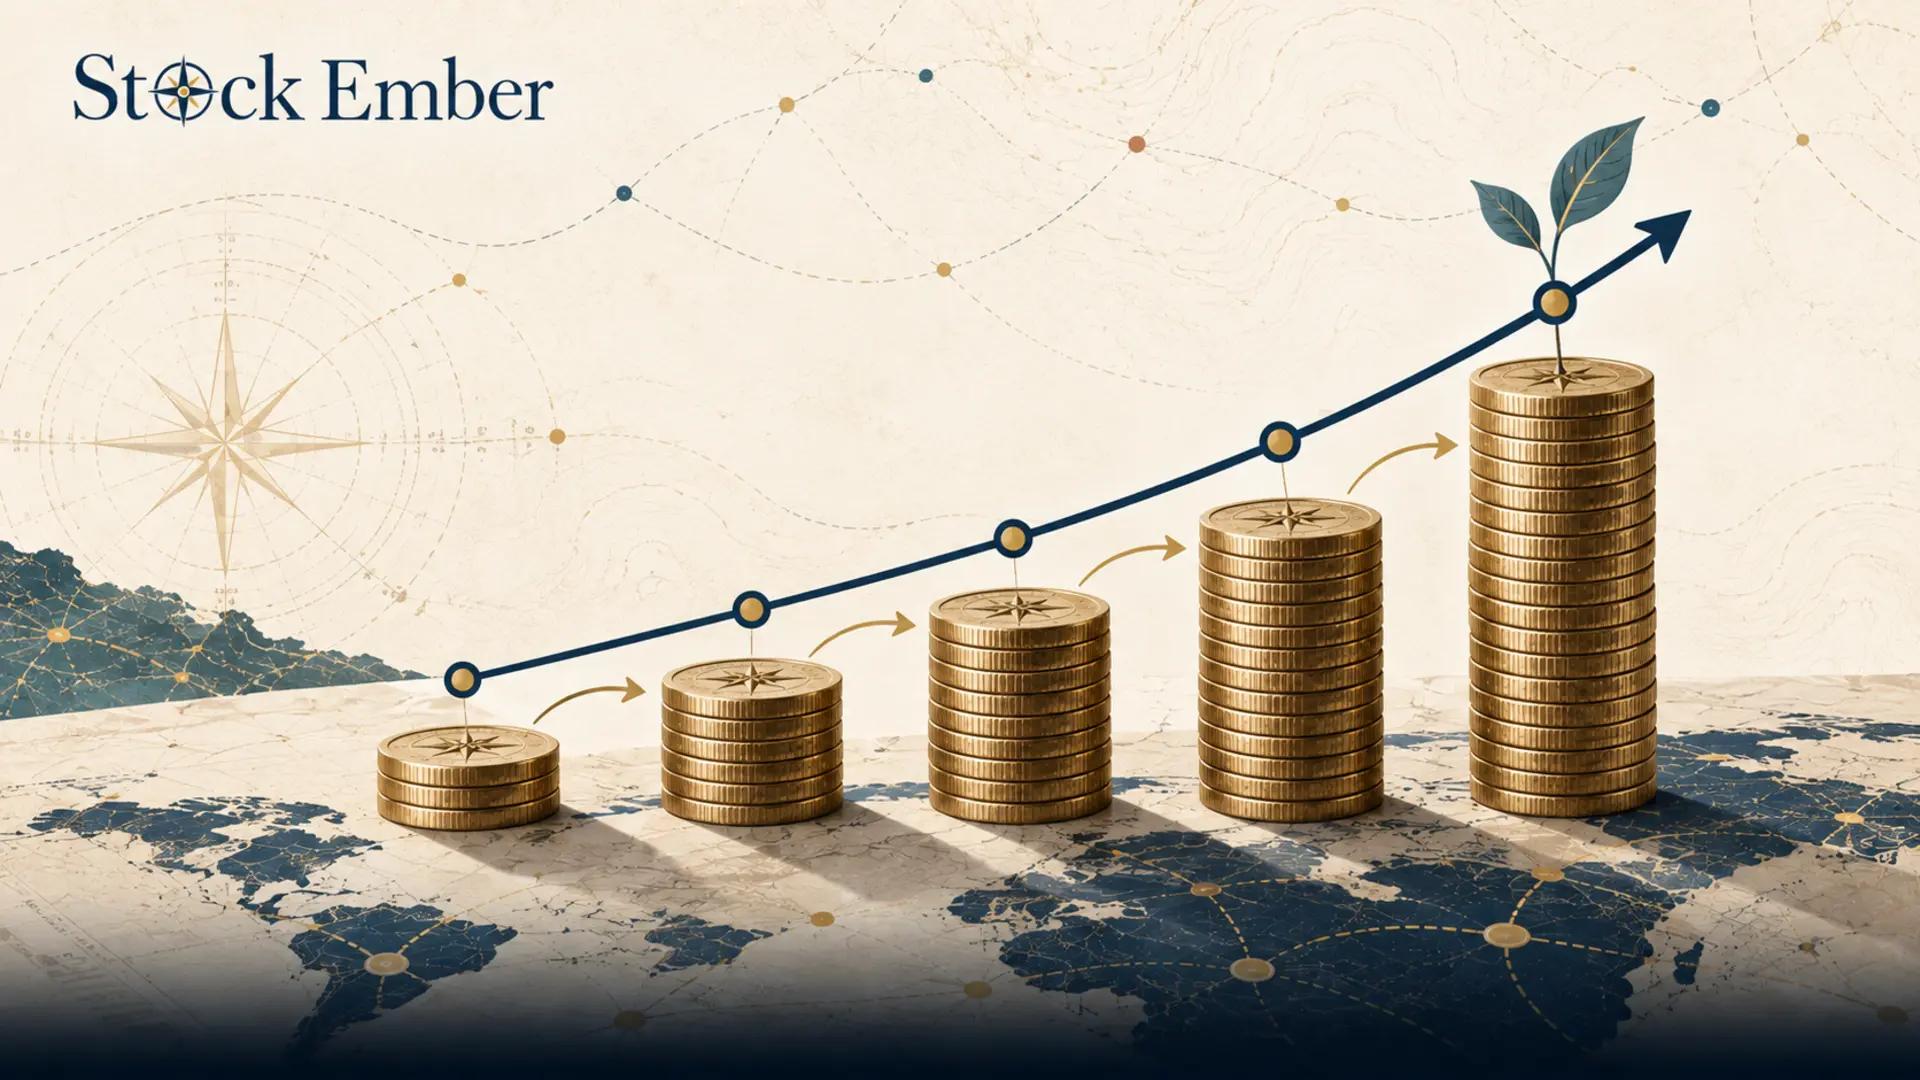
Simple interest calculates returns exclusively on the original principal amount, resulting in linear growth. Compound interest calculates returns on both the initial principal and the accumulated earnings from prior periods, shifting growth onto an accelerating exponential curve.
A dollar invested today is rarely just a dollar tomorrow. For anyone building a long-term portfolio, the mechanism by which your wealth expands depends on a fundamental fork in the financial road: the difference between simple vs. compound interest. Understanding this distinction is the first step toward masterfully navigating the time horizons of retail investing.
In practice, many long-term investors find that while the basic formulas look straightforward on paper, the real-world application changes drastically when you move from fixed-income cash deposits to volatile equity markets. Many individuals spend their early investing years treating market returns as a predictable, linear march, only to realize that true compounding requires enduring major market drawdowns without interrupting the cycle. This guide breaks down the core mechanics of both systems, demonstrates the long-term mathematical reality of compounding, and details the structural pitfalls that can quietly work against your capital over a 10-Year horizon.
Quick Takeaways
01Simple interest calculates returns exclusively on the original principal, resulting in linear growth.
02Compound interest calculates returns on both the principal and the accumulated returns, resulting in exponential growth.
03In equity and ETF markets, compounding is not a smooth, guaranteed track; it requires the deliberate reinvestment of dividends amidst price volatility.
04Investment costs and fees compound against you over time, quietly eroding your long-term returns.
What Is Simple Interest?
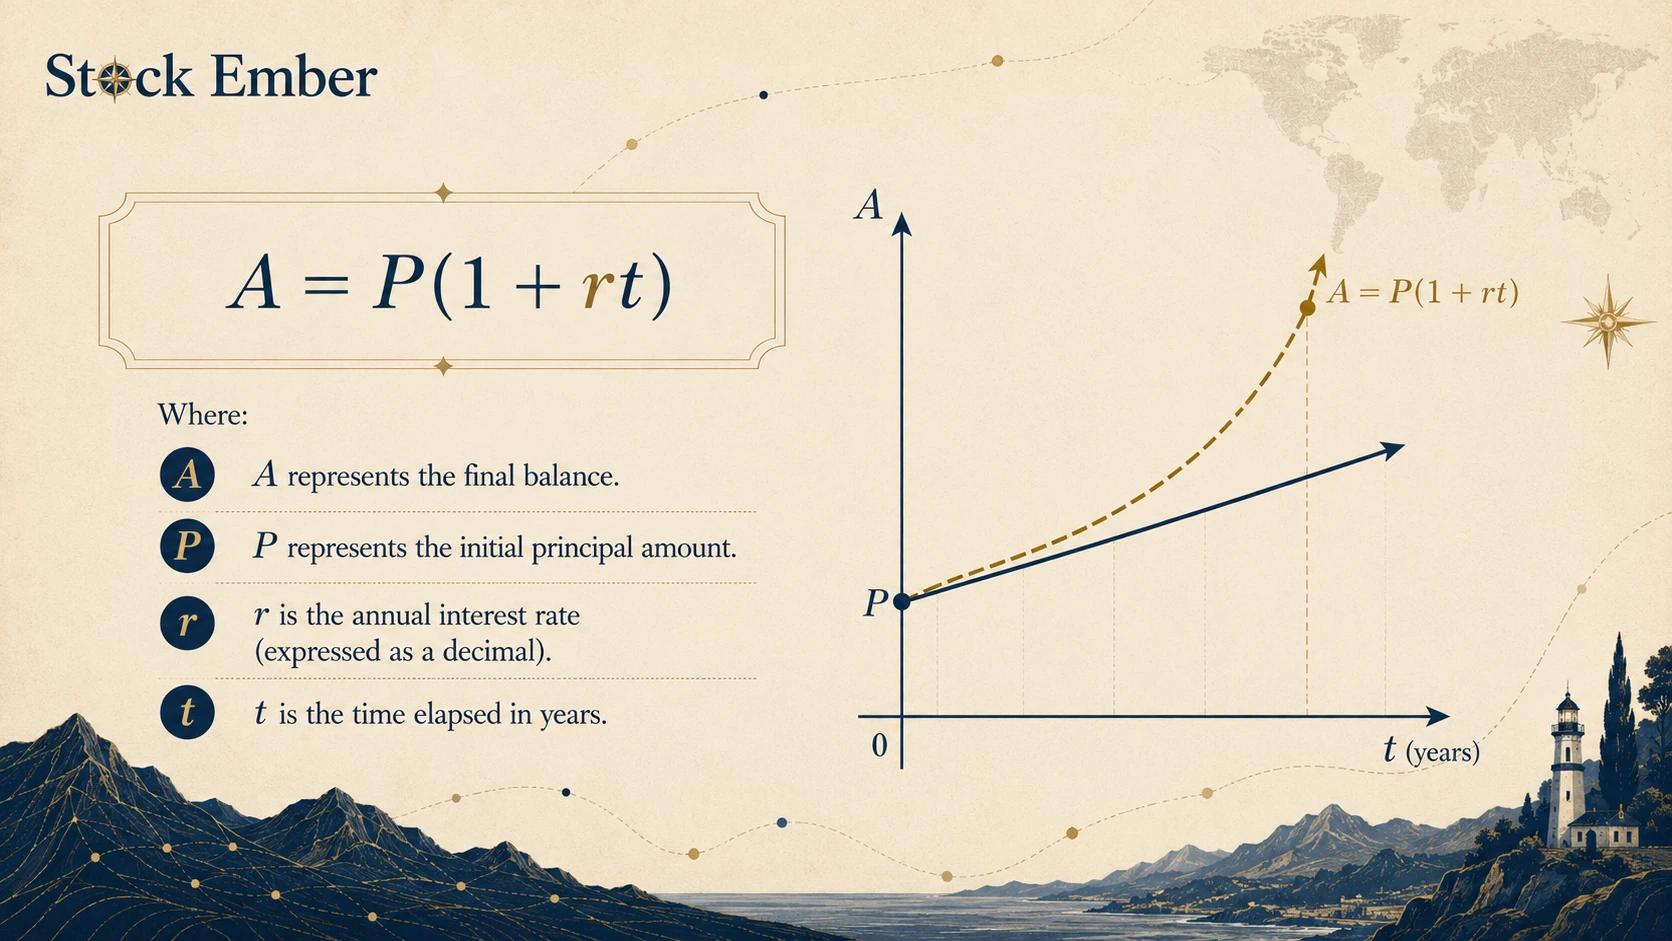
Simple interest is a method of calculating returns where growth is generated solely on the original amount of money deposited or invested, known as the principal. Under this framework, the amount of interest earned remains identical in every period, regardless of how much time passes or how much total value accumulates.
The mathematical expression for simple interest is represented as:
The mathematical expression for simple interest
Because the earnings are never added back to the base metric, simple interest creates a strictly linear trajectory. If you deposit $10,000 at a 5% simple annual rate, you will earn exactly $500 every single year. After 10 years, your total return is $5,000, bringing your total balance to $15,000. The underlying engine never gets bigger.
Simple vs. Compound Interest: The 10-Year Contrast
When evaluated over short horizons, the variance between these two engines appears minor. Over a decade or more, however, the structural gap widens significantly. The following table illustrates the divergence of a hypothetical $10,000 principal growing at an illustrative annual rate of 6%
Year
Simple Interest Balance (6% Annual)
Annually Compounded Balance (6% Annual)
The Compounding Delta
Year 1
$10,600
$10,600
$0
Year 3
$11,800
$11,910
$110
Year 5
$13,000
$13,382
$382
Year 10
$16,000
$17,908
$1,908
Note: This table is entirely illustrative and utilizes round, hypothetical figures to isolate the mathematical mechanics of growth curves.
The Reality of Equity Compounding: Volatility and Dividends
In retail banking, compound interest functions smoothly because savings accounts offer fixed yields. But for long-horizon investors holding equities or exchange-traded funds (ETFs), compounding behaves very differently. Capital markets do not move in a straight line, meaning your compound returns are inherently subject to market volatility.
If a fund drops 20% in value during a market downturn, the base of your compounding engine shrinks. A subsequent 20% gain will not bring you back to even; you actually need a 25% gain to recover your initial capital. This uneven path reflects the asymmetry of losses—often called volatility drag—which dictates that negative years disrupt exponential trajectories far more severely than a smooth average return would suggest.
Furthermore, equities do not naturally "interest compound" on their own. To achieve a compounding effect with individual stocks or equity ETFs, you must understand what is a dividend.
When a company distributes profits to shareholders, that cash leaves the asset. If you take that cash distribution out of your account, you are effectively resetting your portfolio to a simple interest structure. Compounding only occurs if you systematically utilize those payouts to acquire more shares, often measured by tracking the dividend payout ratio to identify stable businesses that consistently fuel this cycle.
The Negative Loop: How Costs Compound Against You
While compounding is a powerful ally for growing wealth, it is a dangerous adversary when applied to investment expenses. Fees, platform charges, and transactional frictions compound against you in the exact same mathematical fashion that returns compound for you.
Consider a retail fund charging a seemingly minor 1% annual fee. If your portfolio generates a hypothetical gross return of 7% per year over a 10-Year horizon, that 1% fee ensures you only net 6%.
A 1%-a-year fee does not just reduce your annual return by a tiny fraction. Because that missing 1% is stripped out every single year, it never gets the chance to compound. Over a 10-Year holding period, that quiet 1% fee structure can eat roughly 10% of your total portfolio's potential value. For any dedicated buy-and-hold strategy, minimizing structural costs over a decade is just as vital as chasing nominal yields.
Conclusion
The mathematical divergence between simple vs. compound interest proves that time and structural efficiency are your most valuable resources. Simple interest keeps your capital anchored to a linear path, whereas compound interest provides the framework required for exponential growth. However, in the equity markets, compounding is never automatic—it demands the disciplined reinvestment of cash payouts and a sober understanding of how market volatility behaves.
Protecting this engine means keeping a sharp eye on the factors you can control: patience, consistency, and structural expenses. When you are ready to evaluate the investment vehicles that house these compounding assets, our ETF reviews provide an objective place to start your analysis.
FAQ
4 questions
Is compound interest always better than simple interest for long-term investors?
For wealth accumulation over a multi-year horizon, compound interest is mathematically superior because it creates an exponential growth curve. Simple interest only generates linear returns, meaning your underlying earnings engine never gets larger. However, compound interest requires you to leave your returns untouched so they can continually reinvest.
How does compound interest differ between savings accounts and the stock market?
In savings accounts, compound interest functions smoothly because financial institutions offer fixed, predictable annual yields. In equity and ETF markets, compounding is driven by market price appreciation and dividend reinvestment, meaning your returns fluctuate with market volatility rather than advancing in a straight line.
What happens if I do not reinvest my dividends?
If you do not reinvest your dividends and instead withdraw the cash distributions from your account, you disrupt the compounding cycle. By removing the earnings, you effectively reset your portfolio to grow on a linear framework similar to simple interest, where future growth relies almost entirely on your initial principal.
How do management fees affect long-term compound growth?
Management fees compound negatively against your portfolio. Because the fee is deducted regularly, that missing capital never gets the opportunity to earn returns. Over a 10-Year holding period, a seemingly small 1% annual fee can quietly strip away roughly 10% of your total portfolio's potential value.
Disclaimer
This guide was written with AI assistance and reviewed by the StockEmber editorial team for accuracy. StockEmber provides independent education, not personal financial advice. Some links may support our work at no additional cost to you.
The StockEmber Team is our in-house desk of independent research writers. We test brokerage platforms, read the fine print on fees and custody, and cover ETFs and long-horizon investing for people who plan to hold for decades — not days.