Gross margin is the percentage of revenue a business retains after subtracting direct production costs, known as Cost of Goods Sold (COGS). It measures core product efficiency and pricing power before general administrative and overhead expenses are applied. A persistently high gross margin may provide a company with more room to absorb rising input costs, but its resilience also depends on pricing power, customer demand, supplier contracts, and operating expenses.
Gross margin is the percentage of revenue a business retains after deducting the direct costs of producing its goods or services. It measures core product efficiency by showing how much gross profit remains before overhead expenses are paid.
When analyzing individual stocks, long-term investors rely on this metric to assess a company's pricing power and manufacturing efficiency. Learning how to read gross margin helps you evaluate whether a business possesses a durable competitive advantage or merely a temporary windfall. This guide breaks down the core calculation, compares gross margin against net profit, and explains why passive investors handle single-stock metrics differently.
Quick Takeaways
01Gross margin measures the proportion of revenue left after subtracting direct production costs (Cost of Goods Sold).
02High gross margins may reflect pricing power or structural cost advantages, but investors should confirm the cause by comparing the company with direct competitors and reviewing its long-term margin trend.
03A company can maintain a high gross margin and still generate a net loss if its operating expenses or interest costs exceed its gross profit.
04Industry norms vary substantially: asset-light software businesses may report much higher gross margins than grocery retailers, which typically operate with narrower margins and higher inventory turnover.
05Long-term index investors naturally capture high-margin market leaders without needing to analyze balance sheets manually.
What Is Gross Margin?
Gross margin represents the core efficiency of a business before taking general administrative, marketing, and corporate costs into account. To understand gross margin in practical terms, consider how a company converts physical inputs or labor into sales revenue. The standard gross margin definition centers on the residual revenue left over after subtracting Cost of Goods Sold (COGS).
Direct costs included in COGS generally consist of raw materials, direct factory labor, assembly expenses, and primary production freight. Indirect corporate overhead such as executive salaries, office leases, broad marketing campaigns, and research and development is explicitly excluded from this calculation.
Knowing where direct production costs end and operating costs begin is essential for evaluating business fundamentals. If a manufacturer sells a power tool for $100 and spends $60 on steel, plastic, and assembly line wage costs, its gross profit is $40. The remaining $40 must cover all other organizational expenses and leave room for a profit.
How to Calculate Gross Margin Percentage
Calculating gross margin requires two straightforward metrics from a company's income statement: total revenue and total direct costs. You first calculate gross profit in absolute dollar terms, then convert that figure into a standardized gross margin % to allow direct comparisons across companies of different sizes.
The mathematical relationships are expressed as follows:
Gross Profit =Revenue - COGS
Gross Margin% = (Revenue - COGS ÷ Revenue) ×100%
Consider a 10-year illustrative example of input cost management. Suppose a business generates $1,000,000 in annual revenue with $600,000 in COGS. Its gross profit is $400,000, yielding a gross margin of 40%.
If input inflation drives direct production costs up to $700,000 the following year while market competition prevents the company from raising its prices, its gross margin compresses to 30% ($\frac{\$300,000}{\$1,000,000} \times 100\%$). Over a decade, persistent margin compression highlights a business losing its competitive edge.
Why Gross Margin Reveals a 10-Year Competitive Moat
Persistent gross margins over a multi-year period can provide evidence of pricing power or production advantages, but investors should assess them alongside market share, return on invested capital, customer retention, and competitive conditions. When a business maintains high gross margins across market cycles, it may indicate pricing power or structural cost advantages. The ability to pass rising input costs directly to customers without sacrificing sales volume.
Companies with wide gross margins enjoy a significant structural cushion against economic shocks. As an illustrative example, a company with a wider gross margin may have more room to absorb an increase in direct costs than a lower-margin competitor, provided that sales volume, operating expenses, and other business conditions remain comparable. The high-margin enterprise retains surplus cash to reinvest in product innovation, brand equity, or supply chain resilience.
In practice, many long-term investors find that tracking changes in gross margin over 5 to 10 years reveals shifts in corporate health far earlier than headline earnings reports. A gradual, multi-quarter decline in gross margin often signals that a business is discounting heavily to defend market share or losing bargaining leverage with suppliers.
Gross Margin vs. Net Margin: Avoiding the "High Margin Trap"
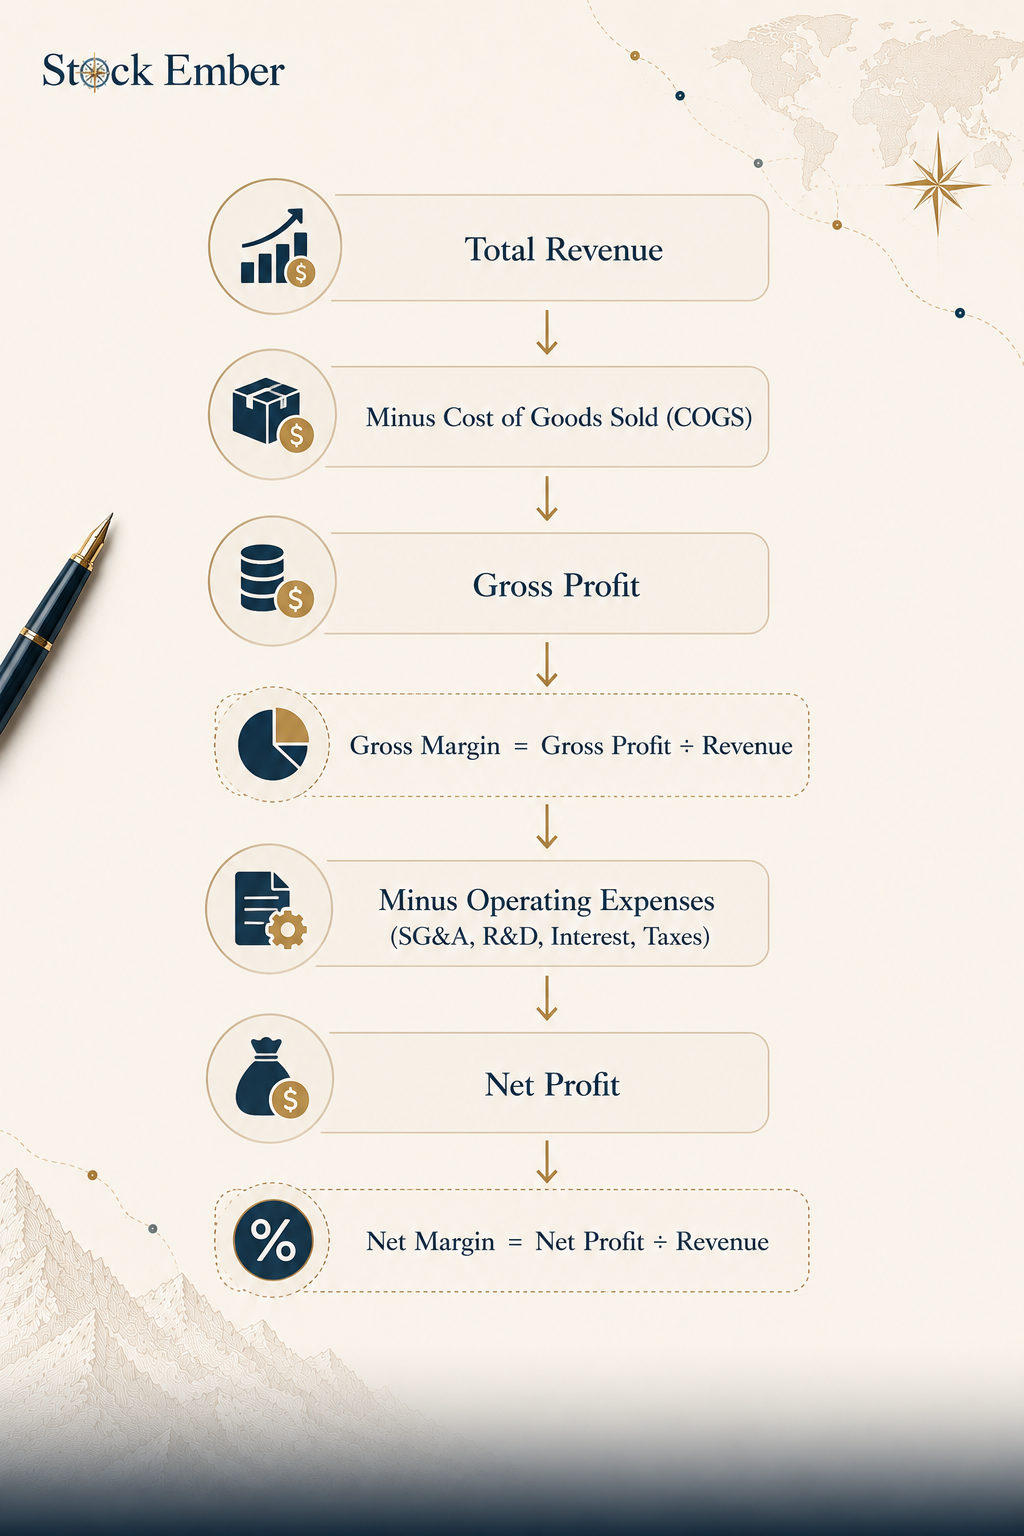
A common mistake among beginner stock analysts is assuming that a high gross margin guarantees overall corporate profitability. While gross margin isolates direct manufacturing efficiency, net margin reflects total profitability after deducting operating expenses, sales costs, executive compensation, research, tax liabilities, and debt interest.
Flow diagram showing how gross margin is calculated from revenue minus cost of goods sold, and how net margin is calculated after deducting operating expenses, interest, and taxes.
A software start-up might boast an enviable 80% gross margin because digital distribution costs virtually nothing. However, if the firm spends 90% of its revenue on aggressive sales teams and stock-based compensation, its net margin will be negative. The business is burning cash despite retaining a large share of revenue after direct costs.
Conversely, high-volume businesses like grocery chains or bulk distributors operate on tight gross margins of 15% to 20%. Because they maintain strict operating discipline and turn over inventory rapidly, they can translate those lean gross margins into reliable, positive net cash flows for shareholders.
Gross Margin Benchmarks Across Key Industries
Product-level profitability varies significantly across different sectors of the economy. Comparing the gross margin of a software enterprise directly against a vehicle manufacturer provides little analytical value because their capital requirements and production structures are entirely different.
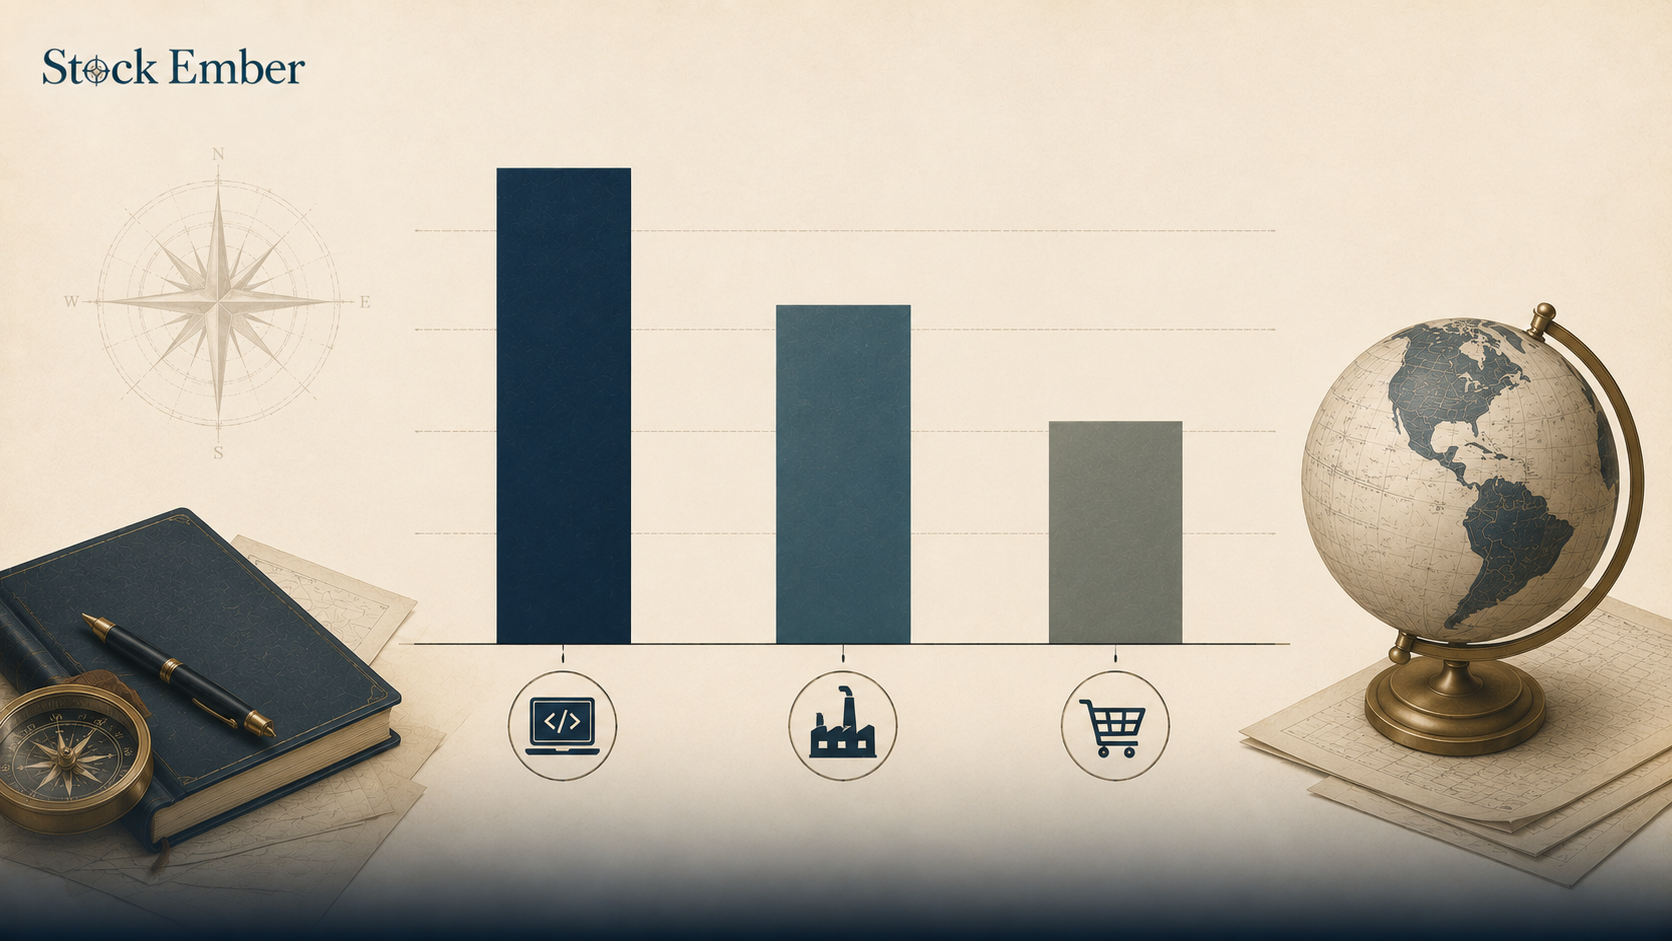
Illustrative bar chart comparing relative gross margin profiles across software, manufacturing, and grocery retail.
Software & SaaS: Software and SaaS companies can report relatively high gross margins because the incremental cost of distributing an additional software subscription may be low, although cloud infrastructure, customer support, licensing, and service-delivery costs can materially affect the result.
Manufacturing & Automotive: Manufacturing and automotive businesses often have lower gross margins than software companies because they incur substantial material, labor, factory, logistics, and warranty-related costs. Investors should compare each company with manufacturers that use similar business models rather than relying on a single industry-wide range.
Retail & Grocery: Grocery retailers generally operate with relatively narrow gross margins because they sell physical inventory in highly competitive markets and must manage spoilage, logistics, and frequent inventory turnover. The appropriate benchmark depends on the retailer's product mix, geography, and accounting classification.
When evaluating a stock, compare this profitability measure with direct peers in the same industry rather than relying on a broad market average.
How Gross Margin Fits into a Long-Term Passive Strategy
Evaluating single-stock operational metrics like gross margin, operating leverage, or the price to book ratiocan offer deep insights into individual business health. However, conducting thorough fundamental analysis across dozens of companies’ financial statements demands continuous effort, accounting knowledge, and regular monitoring.
For investors learning how to invest in stockswith a focus on long-term wealth accumulation, single-stock metric analysis carries distinct risks. A company with excellent historic margins can suffer sudden technological disruption or managerial missteps, eroding its competitive moat unexpectedly.
Long-horizon investors often realize that broad-market index funds resolve this analytical burden naturally. Market-cap-weighted index funds increase or reduce a company’s portfolio weight as its market value changes, but they do not specifically screen companies for high gross margins, profitability, or business quality.
Broad index funds can reduce single-stock concentration risk and lessen the need to analyze every company individually, although investors remain exposed to market declines and companies with weaker fundamentals.
Conclusion
Gross margin measures a company's foundational product efficiency by subtracting direct production costs from revenue. While a high gross margin highlights strong pricing power and manufacturing advantages, it must always be analyzed alongside operating expenses and industry benchmarks to avoid unprofitable traps.
For those pursuing a disciplined, buy-and-hold portfolio, single-stock metrics provide helpful context on corporate quality, but they do not need to dictate your entire investment strategy. When you are ready to evaluate platforms to build your long-term portfolio, our broker reviews offer a clear starting point.
FAQ
5 questions
What is a good gross margin percentage?
A "good" gross margin depends entirely on the industry. Software and technology companies often enjoy gross margins above 70% due to low distribution costs, whereas grocery stores and retailers typically operate on tight margins between 15% and 25%. Rather than comparing across different industries, compare a company's gross margin against its direct competitors and track its trend over 5 to 10 years.
What is the difference between gross margin and net margin?
Gross margin measures profitability after subtracting only direct production costs (Cost of Goods Sold). Net margin evaluates final profitability after deducting all corporate costs, including administrative overhead, research and development, marketing, taxes, and debt interest. Gross margin shows product efficiency, while net margin reflects overall organizational performance.
Can a company have a high gross margin and still lose money?
Yes. A company can generate an 80% gross margin on its products but still report a net loss if its operating expenses run higher than its gross profits. Early-stage tech businesses, for instance, frequently suffer net losses despite high gross margins because they spend heavily on aggressive marketing campaigns, sales teams, and stock compensation.
What is included in Cost of Goods Sold (COGS)?
Cost of Goods Sold includes direct expenses required to manufacture or deliver a product or service. This encompasses raw materials, direct factory labor, assembly line wages, physical packaging, and production freight. COGS explicitly excludes indirect overhead such as executive salaries, office leases, marketing spending, and legal fees.
How does inflation impact a company's gross margin over time?
Inflation raises the direct costs of raw materials, freight, and production labor. If a company lacks pricing power, its gross margin will shrink over time as direct expenses consume a larger portion of sales revenue. Businesses with wide competitive moats can raise prices in step with inflation, preserving their gross margin percentages across economic cycles.
Disclaimer
This guide was written with AI assistance and reviewed by the StockEmber editorial team for accuracy. StockEmber provides independent education, not personal financial advice. Some links may support our work at no additional cost to you.
The StockEmber Team is our in-house desk of independent research writers. We test brokerage platforms, read the fine print on fees and custody, and cover ETFs and long-horizon investing for people who plan to hold for decades — not days.