The dividend growth model is an equity valuation framework that estimates a stock's intrinsic value by calculating the present value of its future dividend payments. By assuming these distributions grow at a constant rate indefinitely, it discounts future income back into current dollars based on an investor's required rate of return.
The dividend growth model is a financial framework used to estimate the intrinsic value of a stock by calculating the present value of its future dividend payments. By assuming these distributions will grow at a constant rate indefinitely, it translates future income streams into today's dollars.
For long-term buy-and-hold investors, buying an equity isn't just a bet on a fluctuating price ticker; it is the purchase of a fractional share in a living business. The ultimate baseline of that business's economic value rests on the cash it returns to its owners over time. Understanding how to model this cash flow helps you anchor your expectations in mathematical reality rather than market sentiment.
Quick Takeaways
01The dividend growth model values a company based on the mathematical present value of its future cash distributions.
02The model relies heavily on a permanent, constant growth assumption, making it highly sensitive to minor input changes.
03It is structurally designed for mature, cash-generating businesses and breaks down completely for fast-growing, non-dividend-paying equities.
What Is the Dividend Growth Model?
"The dividend growth model-frequently referred to as the Gordon growth model formula or the DDM formula is an equity valuation method that assumes a stock's value is derived entirely from its future dividend payments (new to the concept? Start with our guide on what a dividend is). By applying a constant growth rate to these distributions, the model calculates a theoretical fair value for the asset today.
At its core, the model operates on the principle of the time value of money: a dollar received a decade from now is worth less than a dollar in your hand today. To reconcile this, the model takes an expected forward distribution, applies a permanent growth rate, and discounts it back to the present using your required rate of return. The resulting figure is a mathematical baseline of what the asset's cash flow is worth right now.
The Mathematical Engine: The Dividend Growth Model Formula
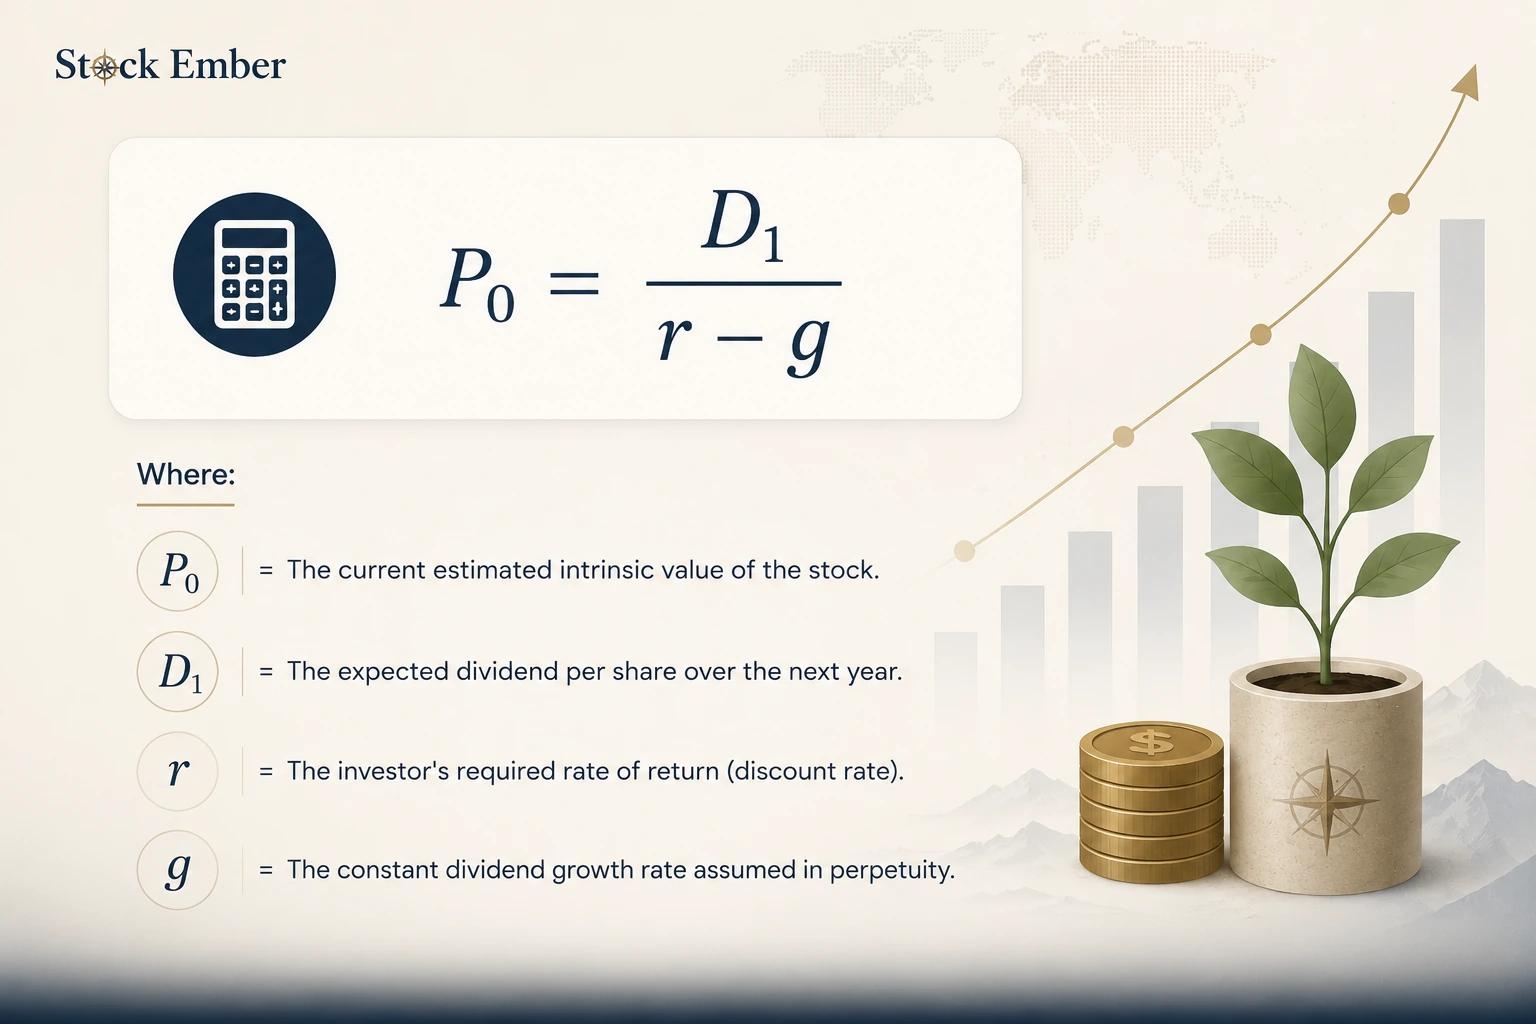
To use this framework, you deploy the core intrinsic value formula. The model condenses an infinite stream of growing future payments into a simple algebraic equation:
The Dividend Growth Model Formula
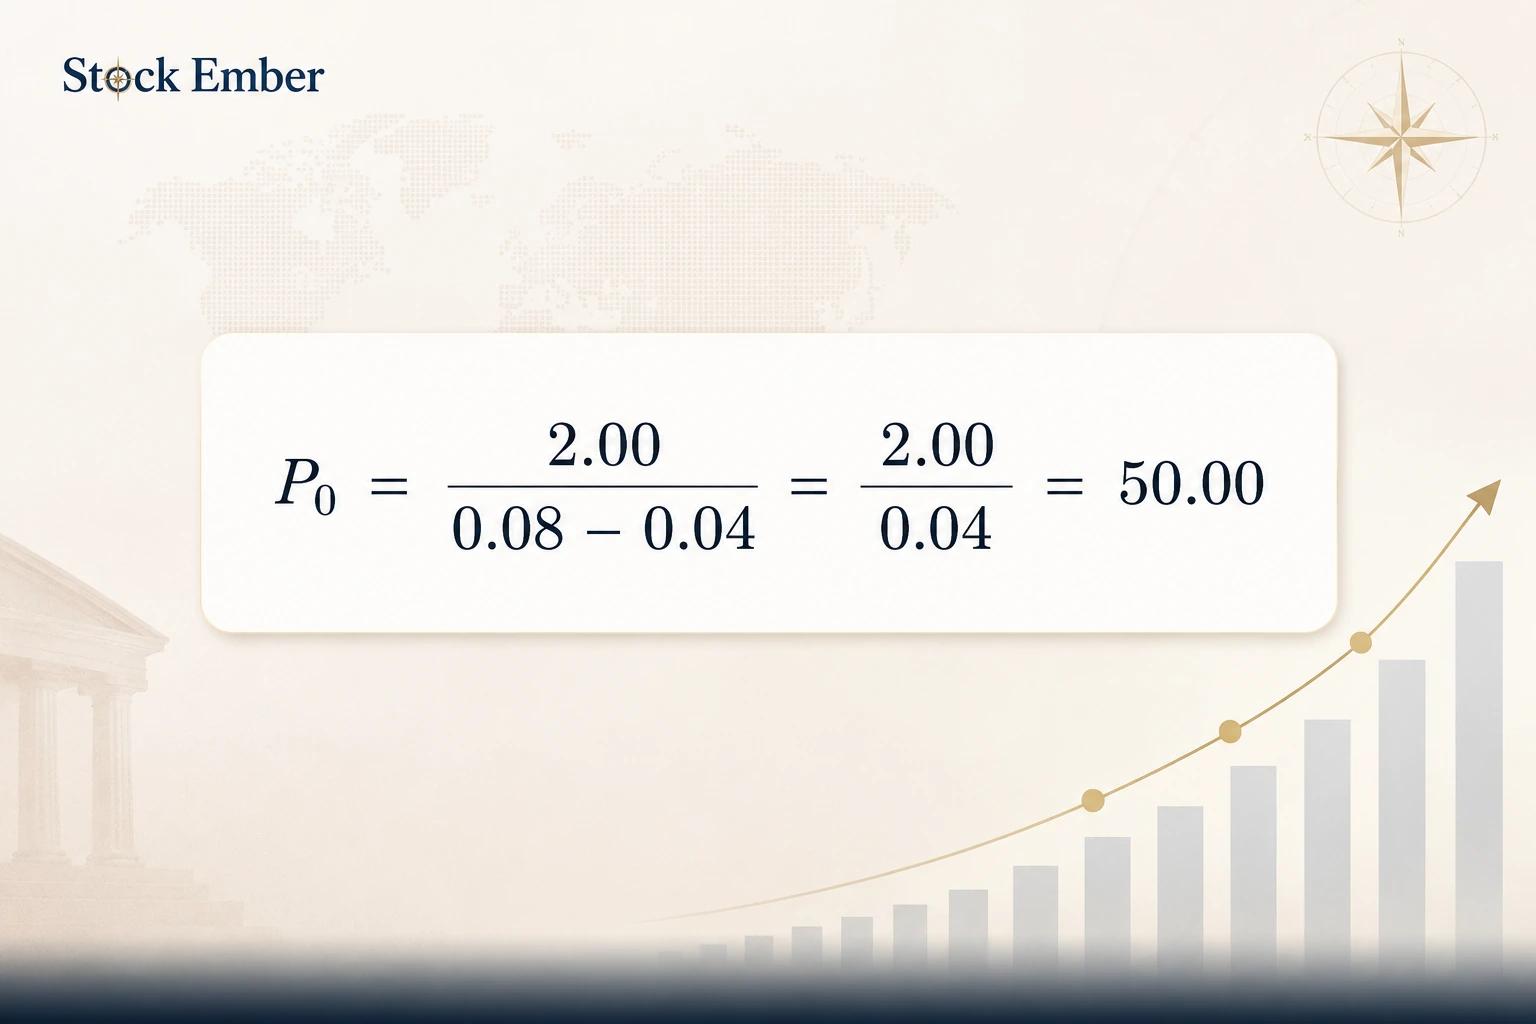
Consider a hypothetical example. Suppose a mature enterprise is expected to pay a dividend of $2.00 per share next year. You decide that based on inflation, opportunity costs, and the asset's risk profile, your required rate of return is 8%. You analyze the business and determine its distributions will grow at a steady pace of 4% annually for the long haul.
Plugging these parameters into the formula yields a clear calculation:
A clear calculation
Under these exact conditions, the structural baseline value for this equity is $50.00 per share. If the market is pricing the stock significantly above this level, it implies the market is anticipating higher growth or tolerating a lower return than your personal baseline requires.
The 10 Year Reality Check: The Power and Danger of Inputs
The absolute simplicity of the dividend discount model is highly deceptive. Because the denominator relies on the spread between two percentages, a fractional shift in your assumptions radically distorts the calculated output.
CFA Institute's curriculum on equity valuation cautions that single-stage models like this one are highly sensitive to their inputs and should be treated as estimates, not absolute calculators; a company's real-world environment is rarely constant.
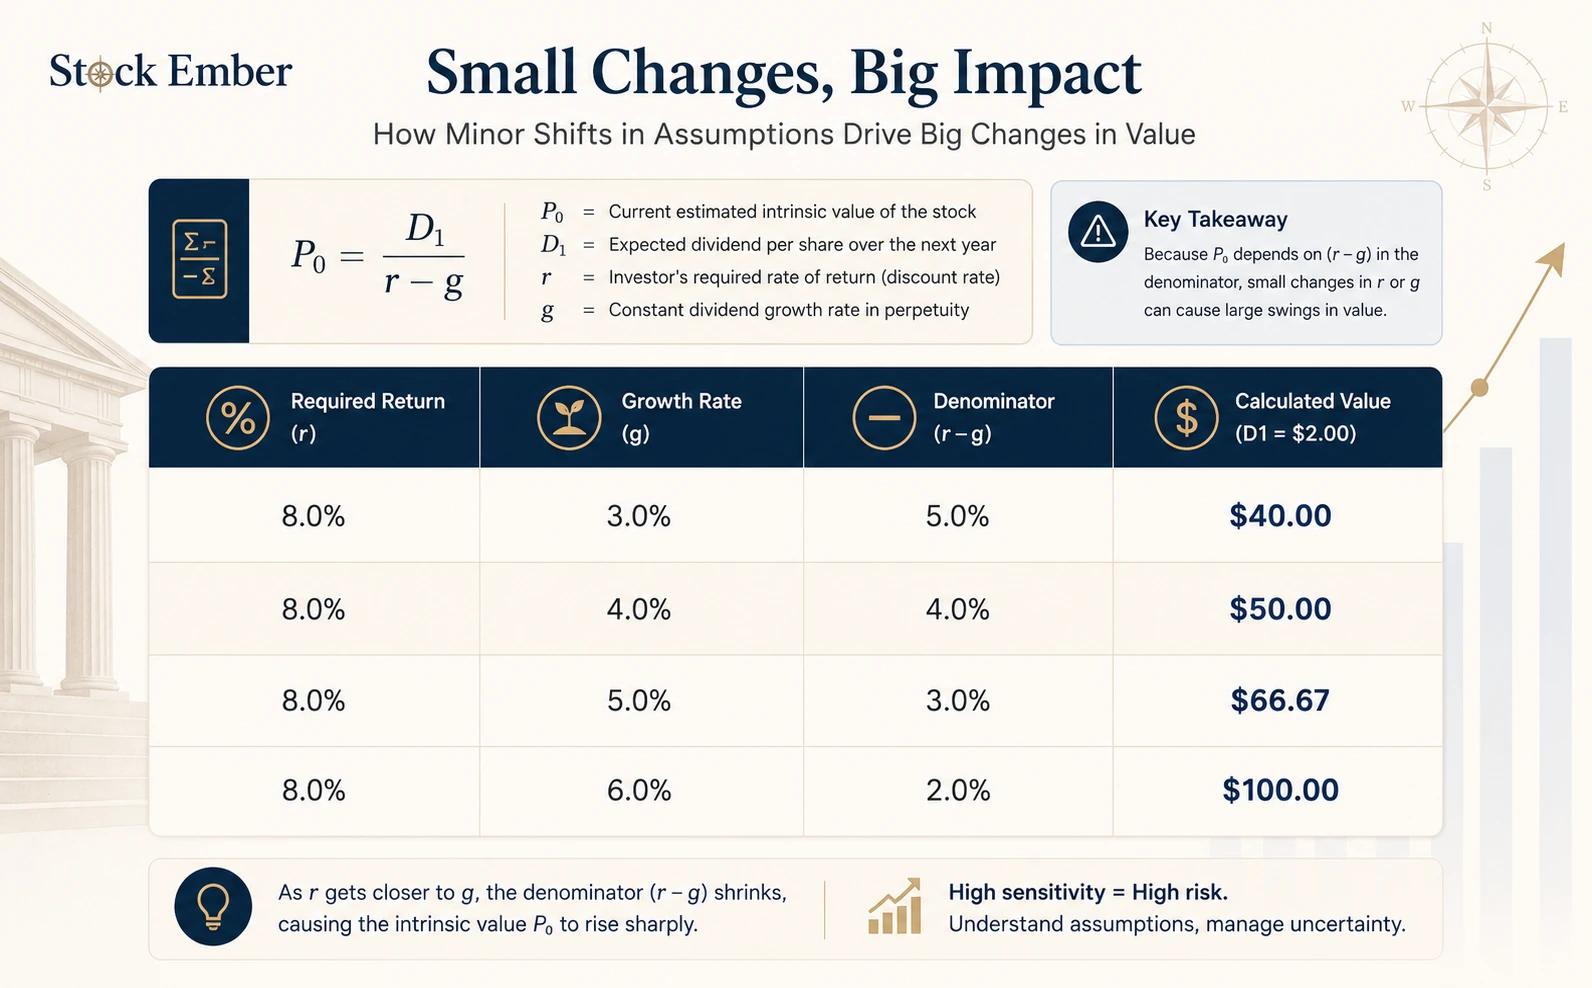
Let’s view this through a 10 year total cost and portfolio lens. Suppose you miscalculate the permanent growth rate, projecting a 5% baseline instead of a true, sustainable 4%. That minor 1% error changes the denominator from 4% down to 3% ($0.08 - 0.05$). Suddenly, the calculated intrinsic value shoots from $50.00 up to $66.67—a massive 33% inflation of what you think the stock is worth.
Over a 10 year holding period, paying an inflated price based on flawed growth assumptions quietly erodes your compounding efficiency. A fee or price premium that seems tiny today accumulates into a major drag over a decade, eating into the capital that should be compounding cleanly within your broader portfolio.
Small changes, big impact
Where the Model Breaks Down
While the math behind the constant dividend growth model is tidy, the real corporate world is messy. The model carries rigid structural boundaries that make it completely non-viable for certain market sectors:
The Growth Rate Trap: Mathematically, if a company's dividend growth rate is equal to or higher than your required rate of return, the denominator becomes zero or negative. The formula breaks completely, outputting an impossible infinite or negative valuation.
Non-Dividend Payers: For modern technology giants or early-stage growth firms that choose to retain 100% of their earnings to reinvest in expansion, the model is entirely useless. If is zero, the model states the company's value is zero, completely ignoring its underlying assets and earnings power.
The Perpetuity Illusion: No business grows at an exact, unyielding percentage forever. Macroeconomic shifts, product lifecycles, and competitive disruption mean that corporate distributions fluctuate constantly.
The Long-Term Investor's Verdict
For individuals focused on steady income generation, this model serves as a great filtering mechanism for analyzing what are dividend aristocrats companies with long track records of maintaining stable distributions. It forces you to think systematically about the relationship between tangible corporate cash flow and your required rate of return.
However, if your core investment strategy relies on broadly diversified index funds or total-return ETFs, you do not need to spend your weekends running individual stocks through equity valuation equations. Modern index strategies bypass the need for single-asset math by capturing the aggregate cash distributions and capital appreciation of hundreds of companies simultaneously. Use the model as a conceptual anchor to understand how assets are valued, but avoid relying on its rigid assumptions as a flawless guide for single-stock picking.
Conclusion
The dividend growth model provides a clear, mathematical perspective on how long-term corporate distributions shape the intrinsic value of an equity today. By anchoring valuation to actual cash returns, it cuts through short-term market noise and emphasizes the power of compounding cash flows. Yet, because the formula is highly sensitive to its growth and return inputs, a tiny analytical misstep can severely distort your long-term expectations. When you are ready to evaluate where to hold your investments and view their systemic impact, our ETF reviews are the natural next step to explore.
FAQ
5 questions
What Is the Main Difference Between the Dividend Growth Model and the Dividend Discount Model?
The dividend discount model (DDM) is a broad family of equity valuation frameworks based on discounting future distributions. The dividend growth model—specifically the Gordon growth model—is a single-stage subset of the DDM that operates on the strict mathematical assumption that a company's dividends will grow at an unvarying, constant rate forever.
Can a Stock's Dividend Growth Rate Be Higher Than the Required Rate of Return?
Mathematically, no. If the constant growth rate matches or exceeds the required rate of return, the formula's denominator becomes zero or negative, breaking the algebraic equation entirely. In the real world, a company may grow dividends faster than its discount rate for a few years, but it cannot sustain this outperformance infinitely.
How Does Inflation Affect the Required Rate of Return in This Formula?
Inflation directly increases an investor's opportunity cost, which pushes the required rate of return higher. Because it sits in the denominator of the formula, a higher required rate of return widens the spread against the growth rate, which mathematically depresses the calculated intrinsic value of the stock.
How Do You Value a Stock That Does Not Pay a Dividend Using This Model?
If a business pays no dividends, the numerator becomes zero, yielding an intrinsic value of zero. For non-dividend-paying equities, such as early-stage growth companies or major technology firms that reinvest 100% of their earnings, investors must use alternative frameworks like discounted cash flow (DCF) models.
Why Is the Dividend Growth Model Highly Sensitive to Its Inputs?
The model relies on the spread between the required return and the growth rate. Because this spread is typically small relative to the inputs themselves, a fractional miscalculation of even 0.5% drastically alters the denominator, causing the calculated intrinsic value to spike or drop disproportionately.
Disclaimer
This guide was written with AI assistance and reviewed by the StockEmber editorial team for accuracy. StockEmber provides independent education, not personal financial advice. Some links may support our work at no additional cost to you.
The StockEmber Team is our in-house desk of independent research writers. We test brokerage platforms, read the fine print on fees and custody, and cover ETFs and long-horizon investing for people who plan to hold for decades — not days.