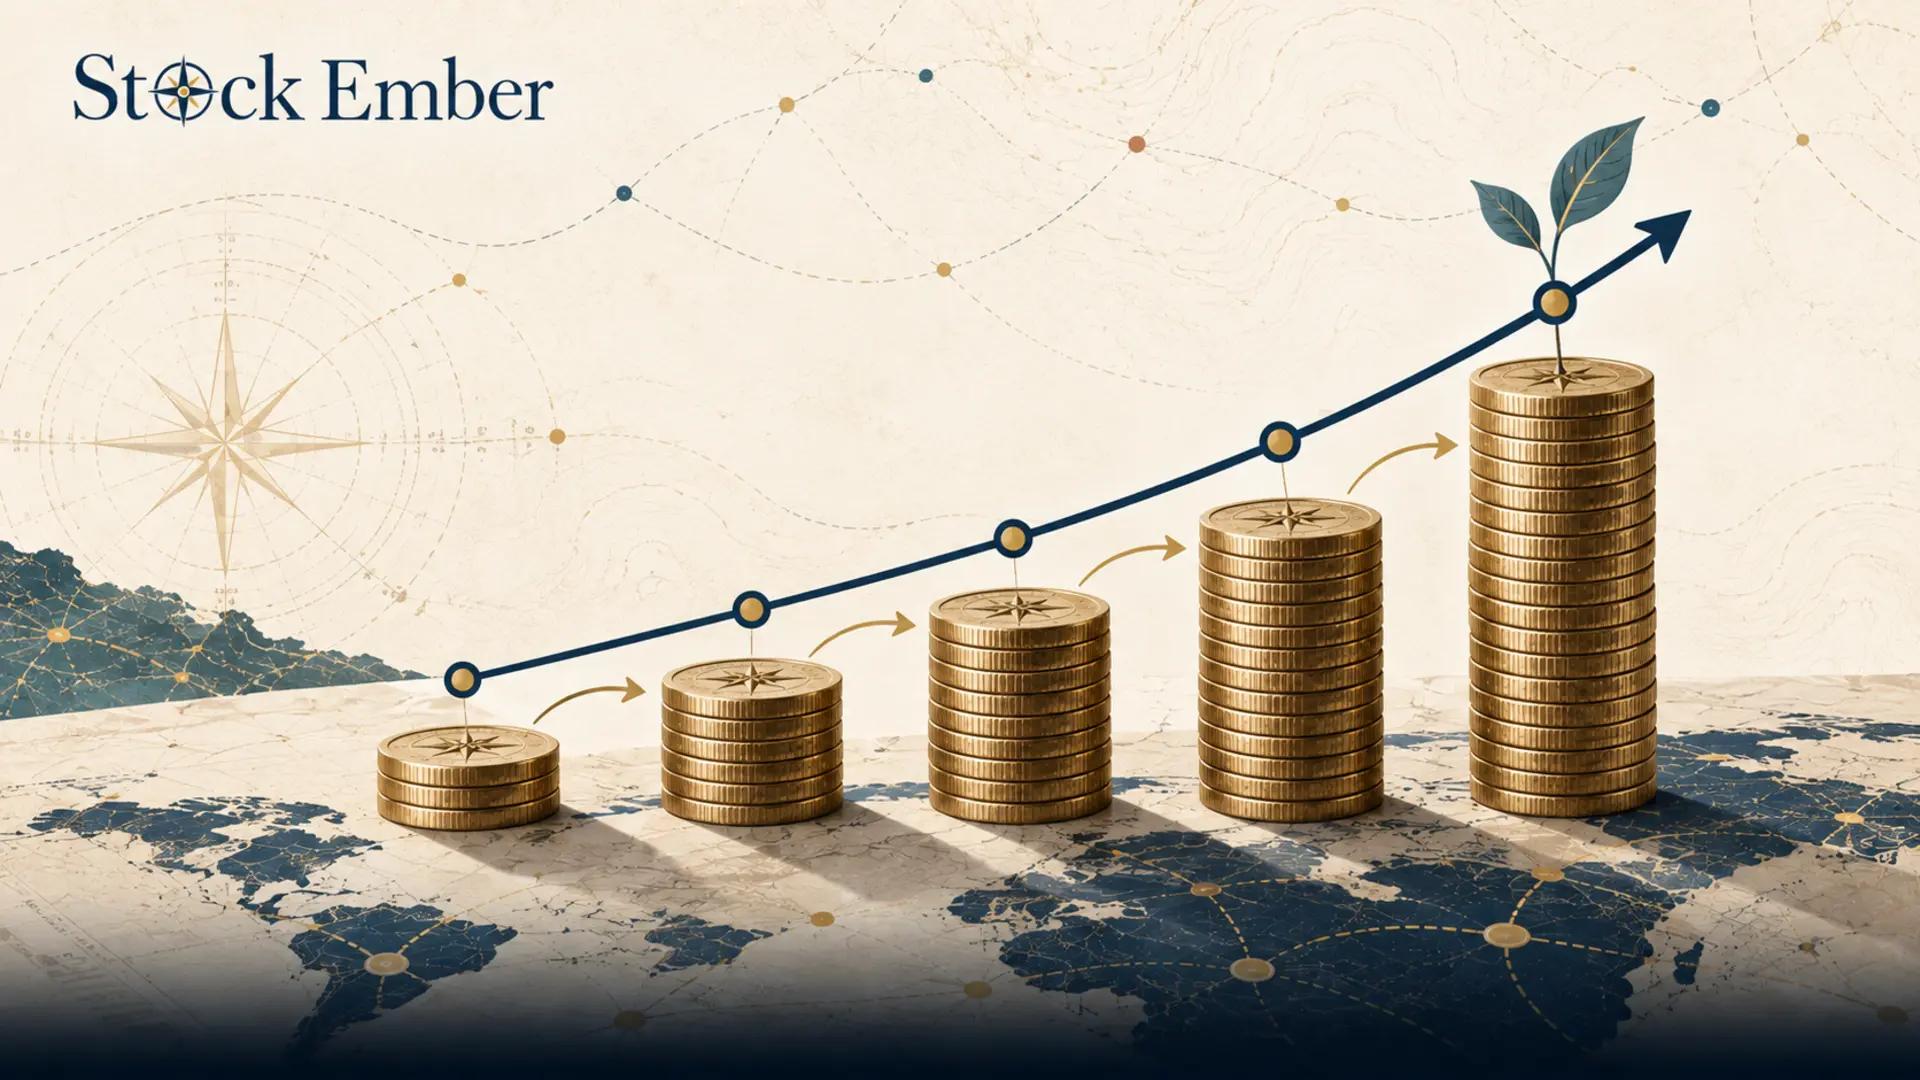
Compound annual growth rate (CAGR) measures the exact geometric rate an investment would need to grow each year to reach its final balance from its starting value over a set period. It cuts through market noise to provide a single, smoothed performance figure that accounts for compounding.
Compound annual growth rate (CAGR) measures the geometric rate at which an investment grows over a multi-year period, assuming all returns compound steadily each year.
If your portfolio gains 20% one year and drops 10% the next, figuring out your true annualized growth is not as simple as taking a simple average. Annual market fluctuations create a distorted picture of long-term performance. CAGR cuts through year-to-year volatility to provide a single, smoothed annual growth figure. This guide breaks down what is CAGR, how to calculate it, and where it can mislead buy-and-hold investors.
Quick Takeaways
01CAGR measures the smoothed annual rate your money would earn if it grew at a steady rate over a multi-year window.
02Unlike a standard arithmetic average, CAGR accounts for compounding and the real mathematical drag of portfolio losses.
03The standard calculation assumes a single lump-sum investment at the start with zero intermediate deposits or withdrawals.
04While useful for comparing historical performance across assets, the metric conceals interim volatility and drawdowns.
What Is CAGR and What Does It Stand For?
To understand what is CAGR in finance, it helps to start with the full terminology. CAGR full form stands for Compound Annual Growth Rate. The core CAGR definition describes how much an investment would grow each year if it expanded at a constant rate with annual compounding.
When asking what does CAGR stand for in practical portfolio management, investors often look for a reliable metric that summarizes multi-year gains. In real markets, stock and ETF values move unevenly. One year brings double-digit growth, while the next brings a sharp market decline. The fundamental CAGR meaning lies in removing that noise: it calculates the exact steady annual growth rate required to take your starting balance to your ending balance over a set period.
How to Calculate CAGR: The Math Behind Compound Growth
Calculating this growth rate requires three variables: the starting value of your investment, the ending value, and the time horizon expressed in years.
CAGR = (Ending Value / Beginning Value)^(1 / Number of Years) − 1
To see how this works in practice, imagine you invest $10,000 into an index fund. Over a 5-year holding period, your account balance grows to $15,000.
Divide the ending value by the starting value: $15,000 / $10,000 = 1.5
Raise 1.5 to the power of 1 divided by the number of years (1 / 5 = 0.2): 1.5^0.2 = 1.08447
Subtract 1 to convert the decimal into a percentage: 1.08447 − 1 = 0.08447, or 8.45%
In this example, your investment produced an annualized return of 8.45% per year. That does not mean your account value grew by exactly 8.45% in every individual twelve-month window. It means an 8.45% steady annual expansion generates the exact same final dollar amount over five years.
Investor education tools provided by financial authorities, such as the U.S. Securities and Exchange Commission, use these identical compounding principles to illustrate long-term growth.
CAGR vs. Average Annual Return
A common mistake among new investors is confusing compound growth with a simple arithmetic average. Relying on simple averages creates an optical illusion due to volatility drag.
Suppose you invest $10,000 into a stock fund. In Year 1, the market falls 50%, reducing your balance to $5,000. In Year 2, the fund rebounds 50%, raising your balance to $7,500.
Return Metric
Performance Sequence
Overall 2-Year Result
Portfolio Balance
$10,000 → $5,000 → $7,500
-$2,500 (-25.0% total loss)
Simple Average Return
(-50% + 50%) / 2
0.0% per year
True CAGR
($7,500 / $10,000)^(1/2) - 1
-13.4% per year
The true annualized return for this two-year window is -13.4% per year. The compound calculation accurately reflects the loss, whereas a simple average hides the real damage done to capital.
The Blind Spots: Volatility, Cash Flows, and Sequence Risk
While CAGR is an essential analytical tool, relying on it blindly creates critical blind spots for long-term investors.
First, the formula smooths out the journey entirely. It cannot tell you whether an asset grew steadily by 7% each year or suffered a 40% mid-period market drop before recovering. It masks drawdowns and sequence-of-returns risk, which matter deeply if you need to withdraw capital during a downturn.
Second, it assumes a single lump-sum investment at the start and zero cash activity afterward. If you add monthly deposits, reinvest dividends manually, or make withdrawals, standard annual rate calculations become mathematically inaccurate. In those scenarios, money-weighted metrics like Internal Rate of Return (IRR) are required.
Finally, consider fee friction over a decade-long horizon. A fund reporting a 9% gross CAGR might sound attractive, but a 1% annual expense ratio erodes that compounded growth over ten years, quietly taking roughly 10% out of your total final wealth.
Conclusion
CAGR provides a clean, standardized metric for comparing historical performance across stocks, index funds, and asset classes over identical timeframes. It eliminates the distorting effects of short-term price spikes and highlights true compound growth. However, remember that historical rates evaluate past performance—they do not serve as a guarantee of future trajectory or market safety.
When you're ready to evaluate long-term portfolio building blocks, exploring our ETF reviews is a sensible next step. Investing always involves risk, including the potential loss of principal, so use it as a helpful historical baseline rather than a single indicator for making allocation decisions.
FAQ
4 questions
What does CAGR stand for in finance?
CAGR stands for Compound Annual Growth Rate. It is a mathematical metric that shows the steady annual rate at which an investment grows over a specific multi-year period, assuming all returns compound each year.
How do you calculate CAGR step by step?
To calculate CAGR, divide your ending investment value by the starting value. Raise that result to the power of 1 divided by the total number of years held, and then subtract 1. Finally, multiply by 100 to get the percentage.
What is a good CAGR for stock market investments?
Broad stock market benchmarks, such as the S&P 500 — as tracked by S&P Dow Jones Indices — have historically produced long-term nominal CAGRs of around 8% to 10% before adjusting for inflation. However, this rate varies greatly depending on the asset class and the specific economic cycle.
What is the difference between CAGR and average annual return?
Average annual return is a simple arithmetic average of separate yearly percentages, which ignores the mathematical drag of losses. CAGR uses geometric compounding to find the true, smoothed annual growth required to reach the final dollar amount.
Disclaimer
This guide was written with AI assistance and reviewed by the StockEmber editorial team for accuracy. StockEmber provides independent education, not personal financial advice. Some links may support our work at no additional cost to you.
The StockEmber Team is our in-house desk of independent research writers. We test brokerage platforms, read the fine print on fees and custody, and cover ETFs and long-horizon investing for people who plan to hold for decades — not days.