A bull market is an extended period of financial market growth where stock prices rise by 20% or more from recent lows, driven by economic expansion and investor optimism. Conversely, a bear market occurs when major market indexes drop by 20% or more from recent peaks, accompanied by economic slowdowns and widespread market pessimism. Understanding both cycle phases helps long-term investors maintain portfolio discipline during market volatility.
A bull market is a broad financial market phase where stock prices rise by 20% or more from recent lows, while a bear market represents a sustained market decline of 20% or more from recent peaks.
Watching portfolio values move up and down during rapid market shifts can cause even experienced index investors to question their strategy. Understanding how these opposing cycle phases operate helps you separate short-term price noise from long-term wealth accumulation.
This guide explains the core differences between bull and bear market conditions, how historical cycles function, and how to maintain portfolio discipline through every market phase.
Quick Takeaways
01A bull market represents a price gain of 20% or more from recent lows, whereas a bear market marks a price fall of 20% or more from recent peaks.
02Bull markets historically last longer than bear markets, allowing long-term market expansion to outpace short-term contractions over multi-decade horizons.
03Minor price pullbacks between 10% and 20% are classified as market corrections rather than full bear markets.
04Attempting to time market shifts often leads to panic selling near cycle bottoms, which permanently harms long-term portfolio compounding.
05A disciplined strategy using dollar-cost averaging helps investors remain invested through both expansionary and contractionary cycles.
What Is a Bull Market vs a Bear Market?
A bull market is an extended period of rising asset prices across broad market indexes, usually accompanied by economic growth and strong investor confidence. Officially, financial markets enter a bull market when major indexes, such as the S&P 500, rise by 20% or more from a previous low point. During a bull market, corporate earnings grow, gross domestic product (GDP) expands, and unemployment figures tend to drop. Investors feel optimistic about future market prospects, which drives increased buying activity and further price gains.
Conversely, a bear market is a prolonged period where stock prices fall by 20% or more from their recent peak levels. The official bear vs bull market definition centers on this 20% threshold, which separates normal market fluctuations from structural market downturns. In a bear market, investor sentiment shifts toward pessimism, leading to widespread selling pressure. Economic indicators often show slowing growth or recessionary conditions, declining corporate profits, and rising job losses.
Understanding the bull market vs bear market definition helps investors recognize that both phases are natural parts of economic activity. While a bull market reflects economic expansion, a bear market reflects contraction and repricing. Recognizing the bull vs bear market meaning allows long-term investors to frame drawdowns, the total percentage drop from a peak to a trough as temporary market conditions rather than permanent financial losses, provided they stay invested in broad market indexes.
Official market definitions and historical thresholds are tracked by regulatory institutions like the U.S. SEC to educate retail investors.
Key Differences: Bull vs Bear Market
The primary difference when comparing a bull market vs bear market involves price direction, investor psychology, duration, and underlying economic health. Comparing what is a bull market vs a bear market requires looking at technical price movement alongside fundamental economic metrics.
During bull markets, positive news events receive widespread attention while bad news is often ignored by buyers. This dynamic creates high demand for stocks, pushing market valuations upward. In contrast, bear markets are defined by extreme risk aversion. Negative economic news triggers heavy selling, and positive corporate reports often fail to rally stock prices.
Historical data shows that these two phases differ significantly in their average duration and overall magnitude. Historically, bull markets last considerably longer than bear markets and produce larger cumulative gains than the losses experienced during downturns.
Trait / Feature
Bull Market
Bear Market
Technical Threshold
Gain of 20% or more from recent low
Loss of 20% or more from recent high
Primary Price Direction
Upward trend with higher highs
Downward trend with lower lows
Investor Sentiment
Optimism, high confidence, risk acceptance
Pessimism, fear, high risk aversion
Economic Backdrop
Expanding GDP, rising profits, low unemployment
Slowing GDP, falling profits, rising unemployment
Average Duration
Approximately 2.7 to 5 years
Approximately 9 to 18 months
Market Volume
High buying volume on price advances
High selling volume on price declines
Cycle Mechanics: Corrections, Bear Rallies, and Macro Drivers
Market movements do not occur in a smooth, straight line. Within every broader trend, minor swings take place that can confuse investors who focus on short-term charts.
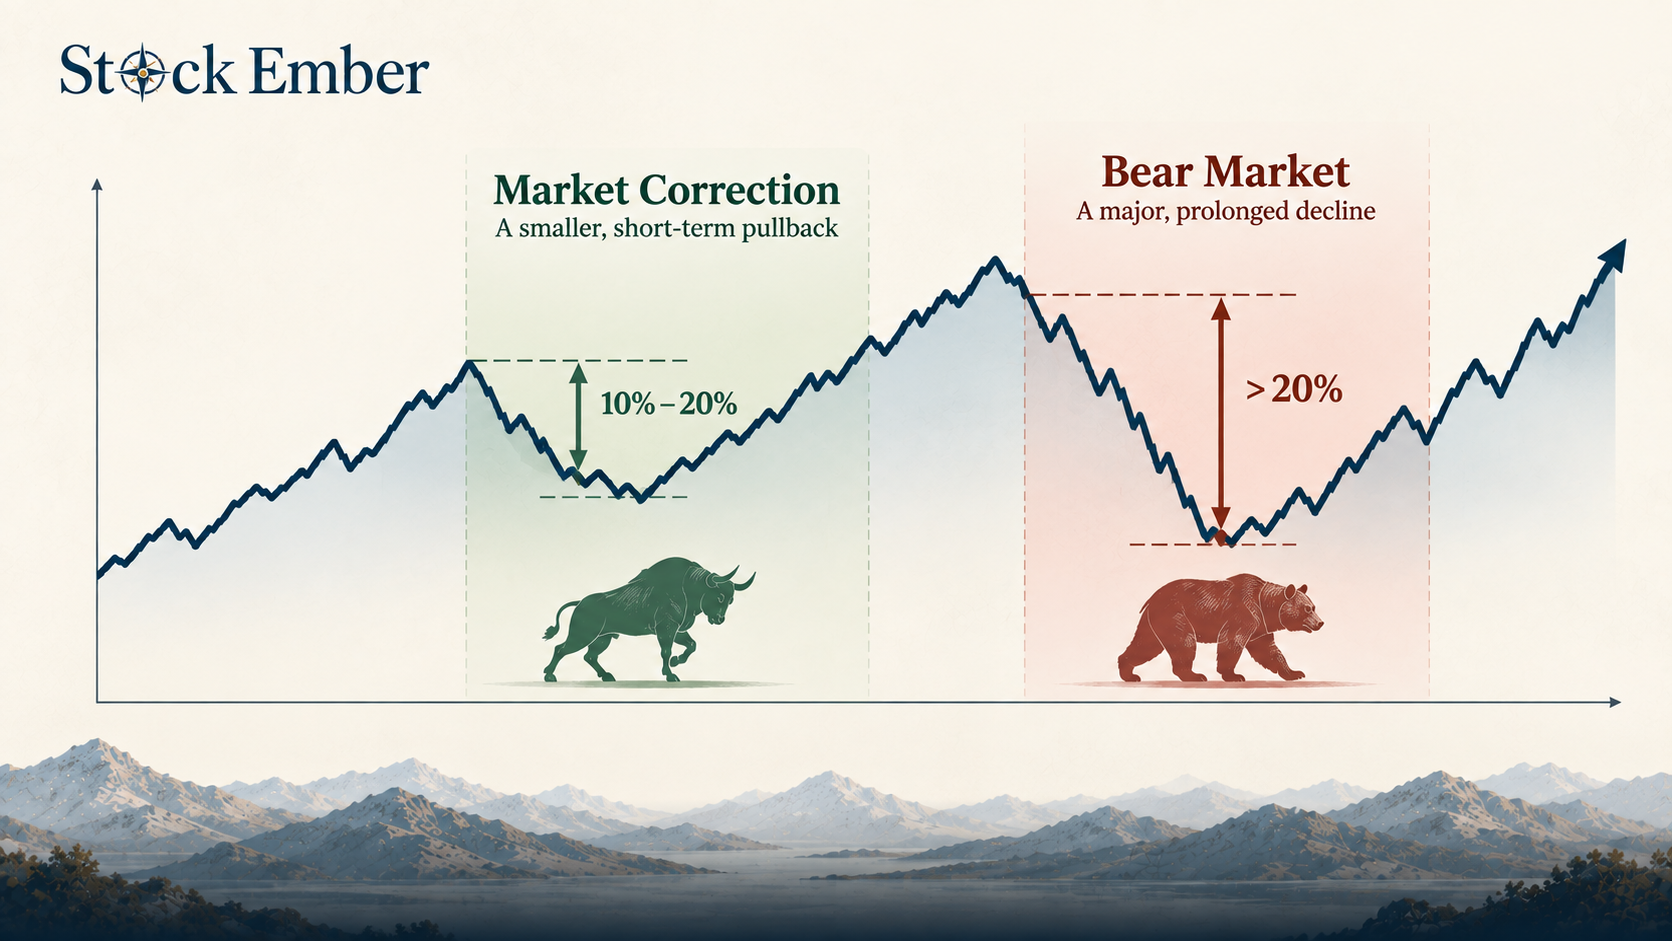
A market correction is a price drop between 10% and 20% from a recent peak. Corrections are frequent, short-lived pullbacks that happen regularly during long bull markets. They serve as brief pauses where high valuations cool off without signaling economic collapse. In contrast, a bear market breaks through the 20% threshold and typically signals deeper structural or economic issues.
Another important phenomenon is the bear market rally, often referred to as a "dead cat bounce." During a severe bear market, stock prices can experience sudden, sharp surges of 5% to 15% over a few days or weeks. These temporary rallies occur when short-sellers buy back shares or optimistic traders buy temporary price dips. Inexperienced investors often mistake a bear market rally for the start of a new bull market, only to see prices resume their downward path.
Diagram comparing a market correction pullback with a full bear market drawdown
Macroeconomic factors play a central role in driving transitions between cycles. Shifts in interest rates, corporate profit margins, and employment trends directly shape market direction. Furthermore, understanding how inflation affects the economy clarifies how rising consumer costs prompt central banks to raise interest rates, which can slow economic growth and trigger bear market conditions.
Portfolio Strategy Across Market Cycles
For long-term buy-and-hold investors, bear markets should be understood as an unavoidable stage of the overall market cycle. Attempting to predict exact market tops or bottoms is notoriously difficult, even for professional managers.
Selling stocks during a bear market converts temporary paper losses into permanent capital losses. Missing just a handful of the market's best recovery days, which frequently happen during or immediately following severe downturns, can drastically reduce total multi-decade returns.
In practice, many long-term investors find that continuing automated regular contributions during market declines allows them to purchase index fund shares at discounted prices, lowering their average purchase price over time.
Maintaining a balanced portfolio strategy requires two key habits:
Dollar-Cost Averaging: Investing a fixed cash amount at regular intervals regardless of whether prices are rising or falling. This practice removes emotion from investing decisions and ensures you automatically buy more shares when prices are low.
Periodic Rebalancing: Adjusting your asset allocation back to your target weights once or twice a year. Rebalancing naturally forces you to sell asset classes that have grown expensive and buy asset classes that have become cheap.
Common Pitfalls During Bull and Bear Markets
Emotional reactions to short-term price movements lead to predictable mistakes across both phases of the market cycle.
Bull Market Pitfalls:
Chasing Returns: Buying high-risk assets near peak valuations out of fear of missing out (FOMO).
Ignoring Risk Tolerance: Assuming high market volatility is easy to handle when prices are rising continuously.
Abandoning Allocation: Concentrating funds into top-performing single sectors while ignoring core portfolio diversification.
Bear Market Pitfalls:
Panic Selling: Liquidating index holdings at low prices to stop temporary portfolio losses.
Stopping Contributions: Pausing monthly investment plans during downturns, missing out on lower share prices.
Market Timing Attempts: Holding excessive cash while waiting for a clear sign that the market bottom has passed.
Conclusion
Market cycles naturally alternate between long periods of bull market expansion and shorter periods of bear market contraction. While sharp price drops can feel uncomfortable, history demonstrates that market indexes have recovered from every downturn to achieve new all-time highs over long multi-decade horizons.
Staying disciplined through both phases protects your portfolio from emotional errors like panic selling or performance chasing. By maintaining regular contributions through dollar-cost averaging and keeping a long-term perspective, you allow compounding to work uninterrupted across full market cycles.
When you are ready to build a balanced core portfolio suited for every market phase, reviewing our analysis in ETF reviews is a practical next step. Investing always involves the risk of capital loss and past market cycle performance does not guarantee future results, so use this guide for educational clarity as you construct your long-term plan.
FAQ
5 questions
What is the main difference between a bull and a bear market?
The main difference lies in market direction and overall investor sentiment. A bull market is characterized by rising stock prices (at least 20% up from recent lows), strong economic growth, and high investor confidence. A bear market features declining stock prices (at least 20% down from recent peaks), economic slowdown, and widespread pessimism.
How long do bull vs bear markets typically last?
Historically, bull markets last significantly longer than bear markets. While average bull markets span roughly two to five years, average bear markets tend to last between nine and eighteen months. This structural duration difference allows long-term equity market growth to outpace temporary downturns across multi-decade horizons.
What is the difference between a market correction and a bear market?
A market correction is a short-term pullback where stock prices fall between 10% and 20% from a recent peak, usually representing a routine cooling period in an ongoing trend. A bear market is a deeper decline where prices drop by 20% or more from recent peaks, often reflecting broader macroeconomic structural weaknesses.
What is a bear market rally?
A bear market rally, often called a "dead cat bounce," is a sharp, temporary rise in stock prices during a prolonged downward market trend. Prices can briefly rebound 5% to 15% before resuming their downward trajectory, which frequently traps short-term traders attempting to time the market bottom.
Should long-term investors stop investing during a bear market?
Long-term index investors generally benefit from continuing their scheduled contributions during a bear market. Selling assets or pausing contributions locks in paper losses and hazards missing initial recovery gains. Maintaining consistent purchases through dollar-cost averaging enables investors to accumulate index fund shares at discounted valuations.
Disclaimer
This guide was written with AI assistance and reviewed by the StockEmber editorial team for accuracy. StockEmber provides independent education, not personal financial advice. Some links may support our work at no additional cost to you.
The StockEmber Team is our in-house desk of independent research writers. We test brokerage platforms, read the fine print on fees and custody, and cover ETFs and long-horizon investing for people who plan to hold for decades — not days.