Survivorship bias is a statistical sampling error where performance analysis focuses exclusively on surviving investments while omitting those that failed or liquidated. This omission creates an optimistic distortion, making trailing mutual fund averages and historical backtested strategies appear significantly higher than actual investor outcomes.
Survivorship bias is a statistical error that occurs when an evaluation focuses only on surviving investments while ignoring those that failed, merged, or liquidated, resulting in artificially inflated historical performance metrics.
Looking at a mutual fund category with a high historical return makes picking a fund feel simple. However, if half the funds in that category failed and closed over the decade, the true average return for investors was much lower. This guide explains how survivorship bias works, how it distorts market data and historical backtests, and how long-term investors can protect their portfolios from false expectations.
Quick Takeaways
01Survivorship bias occurs when historical analysis excludes closed, merged, or failed investments.
02Omitting dead mutual funds artificially inflates average industry returns and manager performance records.
03Backtesting investment strategies on current index members introduces severe optimistic distortion.
04Broad-market index funds provide realistic market returns without relying on fund selection survival luck.
What Is Survivorship Bias?
Survivorship bias is a selection error where data sets only include entities that survived a specific timeframe, hiding the failures that occurred along the way.
When you look at a group of companies or funds today, you are only seeing the survivors. The entities that failed along the journey have dropped out of view. Because only the successful or durable entries remain, any calculation of average performance becomes artificially skewed toward success.
A classic illustration of this concept comes from wartime armor selection. During World War II, military analysts studied returning aircraft to see where bullet holes were most frequent, intending to add armor to those damaged spots. Statistician Abraham Wald pointed out the logical error: they were only inspecting bombers that survived the flight.
The planes that were shot in critical areas like the engine had crashed and could not be examined. Adding armor to the untouched areas on returning planes was actually the right decision because hits in those spots were fatal to the planes that never made it back.
In financial markets, a similar error happens constantly. Companies go bankrupt, stocks get delisted, and bad mutual funds close down. If an investor only evaluates the funds and companies visible today, the historical record looks far better than reality.
How Survivorship Bias Distorts Fund & Market Data
Survivorship bias distorts investment data by removing dead funds and delisted stocks from historical averages, making historical returns appear higher than they actually were. Once you understand what survivorship bias is, the next step is seeing exactly how it distorts fund and market data in practice.
In the mutual fund industry, underperforming funds do not stay open forever. When an active fund suffers poor performance, investors withdraw their money. Eventually, the fund family either liquidates the fund entirely or merges it into a larger, more successful fund to hide the bad track record.
When researchers or database providers calculate the 10-year average return of mutual funds in a specific category, they often calculate the average of funds that exist right now. According to long-term market research from S&P Dow Jones Indices, a large percentage of active mutual funds close or merge over a 10-to-15-year window.
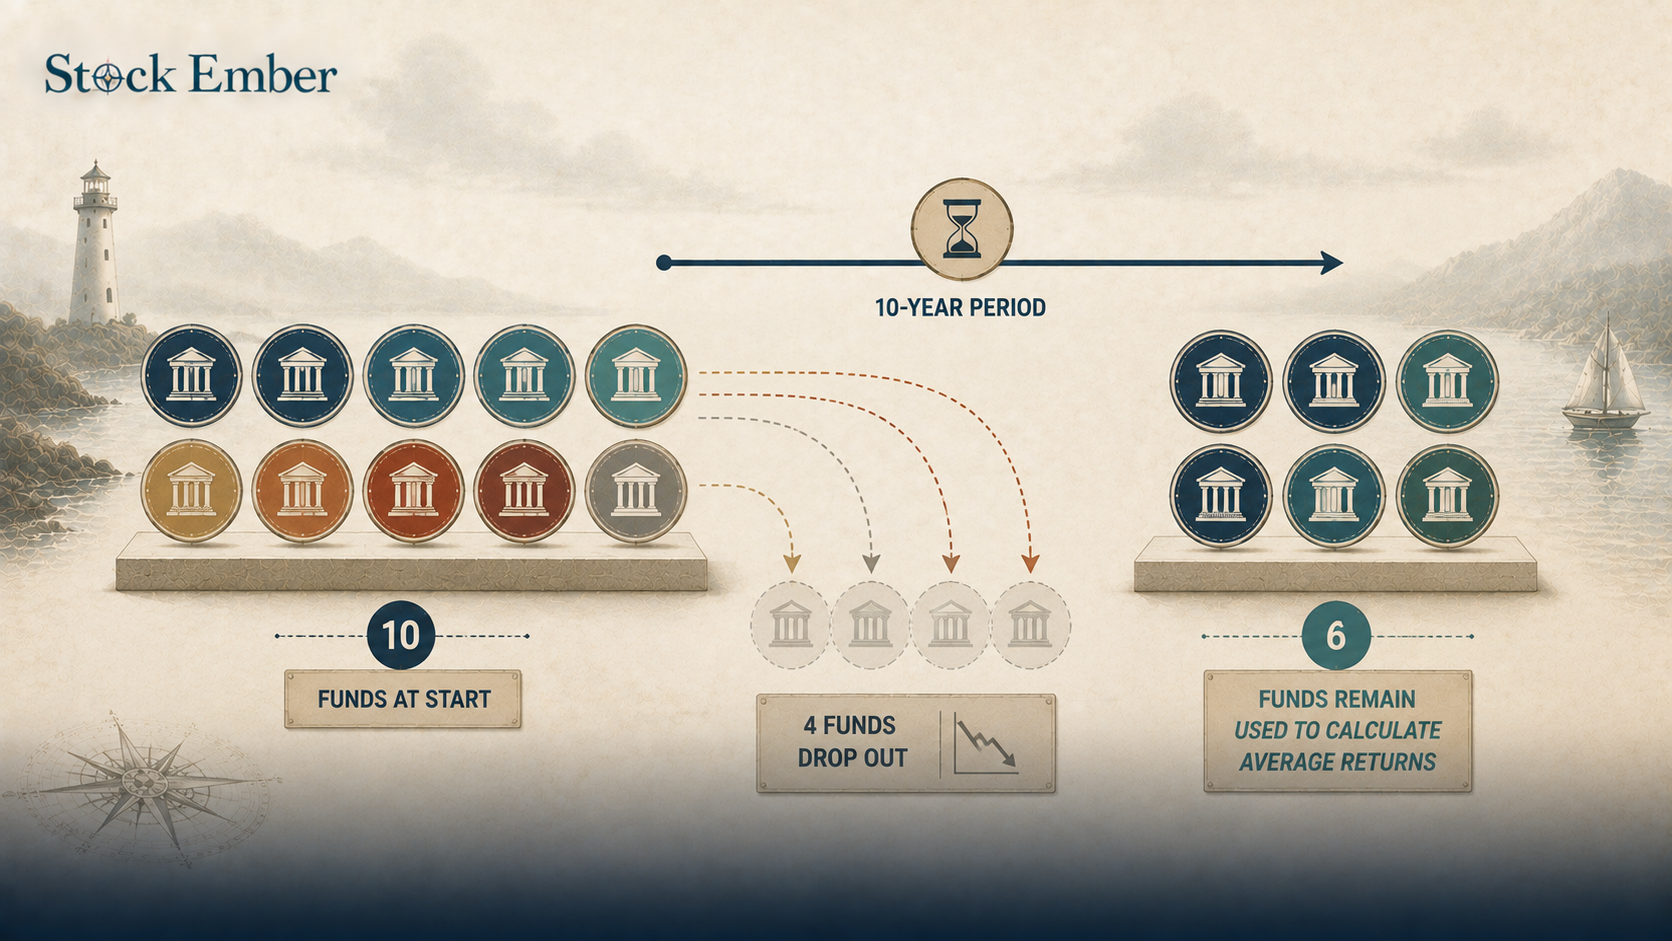
If a database starts with 1,000 funds, and 400 of them close due to heavy losses over ten years, calculating the average return of the 600 remaining funds creates an optimistic illusion. The 400 failed funds and their negative returns simply vanish from trailing average calculations.
Diagram showing how fund attrition inflates historical average mutual fund returns.
Backtesting Traps and Behavioral Errors
If you've ever tested a strategy against today's index members, you may have unknowingly built in survivorship bias. Backtesting investment strategies using current index members creates misleading historical charts because it tests rules only on companies that succeeded.
Many investors build quantitative strategies by running a stock screener against current market benchmarks. For example, an investor might test a strategy of buying high-dividend stocks from the S&P 500 over the last 15 years.
However, if the backtest uses the current list of S&P 500 constituents, it introduces severe survivorship bias. It applies the strategy only to companies that are large and successful enough to be in the index today. It completely skips companies that were in the index 15 years ago but suffered severe drawdowns, went bankrupt, or were removed. Running a backtest without historical point-in-time data gives investors false confidence in an over-optimized strategy.
This statistical mistake links directly to concepts in behavioral finance. Investors naturally pay attention to visible success stories such as famous market winners, while ignoring silent failures.
It also connects to how people handle money through mental accounting. Investors often compartmentalize their winning positions while mentally discarding past losses, creating a personal form of survivorship bias in how they assess their own historical track record.
The 10-Year Portfolio Reality: Accounting for Attrition
Accounting for fund attrition reveals that true market returns over a 10-year period are lower than advertised survivor averages.
When evaluating historical claims, buy-and-hold investors must look past survivor-only database figures to understand the full market picture.
Perspective
What the Data Shows
The Missing Reality
Mutual Fund Peer Averages
Advertised 8.5% category return
Closed funds with heavy losses are excluded
Strategy Backtests
High historical win rate
Uses current index stocks instead of point-in-time members
Top Stock Picks
Highlighted multi-bagger winners
Ignores delisted or bankrupt companies
Index Fund Baseline
Tracks full market return
Automatically handles company additions and drops
Over a ten-year holding horizon, fund attrition creates a hidden performance tax on active fund selection. On a $100,000 investment over ten years:
An active fund category advertised with an 8.5% average return might actually reflect a lower average when dead funds are included.
That 2% gap in return expectations equals tens of thousands of dollars in lost compounding over a decade.
Additionally, when an active fund liquidates mid-decade, investors are forced to realize capital gains or losses prematurely, creating tax friction.
In practice, many long-term investors find that reviewing backtested performance strategies looks impressive on paper, but real-world results lag when delisted companies are added back into historical data.
Common Pitfalls for Buy-and-Hold Investors
Long-term investors can protect their capital by recognizing common data traps that hide historical losses:
Trusting backtested stock screeners: Assuming a simple historical strategy works without verifying if the testing software uses point-in-time database membership.
Relying on trailing 10-year manager records: Judging a fund family by looking only at their current surviving funds while ignoring funds that were quietly closed or merged.
Overestimating individual stock odds: Assuming long-term stock picking is easy by focusing on market giants while ignoring hundreds of companies that quietly failed.
Conclusion
Survivorship bias creates an overly optimistic picture of historical investment returns by hiding failed funds and bankrupt companies. Recognizing this bias helps investors avoid chasing historical manager track records and flawed backtest charts. Holding low-cost, broad-market index funds allows investors to capture overall market growth without betting on fund survival luck.
When you are ready to evaluate funds for your portfolio, our ETF reviews provide clear comparisons of available options. Investing always puts capital at risk and past performance does not guarantee future results, so use this breakdown as educational guidance for your own research.
FAQ
5 questions
What is survivorship bias in simple terms?
Survivorship bias happens when people evaluate a group by looking only at the "survivors" that made it through a selection process while completely ignoring the ones that failed along the way. In financial markets, this means focusing only on existing companies or funds while ignoring dead ones, making past performance look unnaturally good.
How does survivorship bias affect mutual fund returns?
When underperforming mutual funds close or merge into larger funds, financial databases often remove their poor performance records from historical category tracking. As a result, trailing 10-year category average returns only reflect the funds that survived, artificially inflating reported industry performance figures above what average investors earned.
Why is survivorship bias dangerous in historical backtesting?
Backtesting an investment strategy using today's index members introduces survivorship bias because it tests rules exclusively on companies that succeeded enough to remain in the index. It ignores companies that were index members years ago but suffered severe drawdowns or bankruptcy, giving investors false confidence in an over-optimized strategy.
What is a classic real-world example of survivorship bias?
During World War II, statistician Abraham Wald analyzed returning bombers with bullet damage. While military leaders wanted to reinforce areas with bullet holes, Wald pointed out that they were only inspecting planes that survived the flight. The planes hit in vital areas like the engine had crashed and could not be examined, proving that undamaged areas on returning planes actually needed armor most.
How can long-term investors protect against survivorship bias?
Investors can protect themselves by relying on point-in-time database figures when evaluating quantitative strategies, auditing closed or merged funds when reviewing manager track records, and using low-cost broad-market index funds. Index funds track total market development automatically without relying on individual fund manager survival luck.
Disclaimer
This guide was written with AI assistance and reviewed by the StockEmber editorial team for accuracy. StockEmber provides independent education, not personal financial advice. Some links may support our work at no additional cost to you.
The StockEmber Team is our in-house desk of independent research writers. We test brokerage platforms, read the fine print on fees and custody, and cover ETFs and long-horizon investing for people who plan to hold for decades — not days.