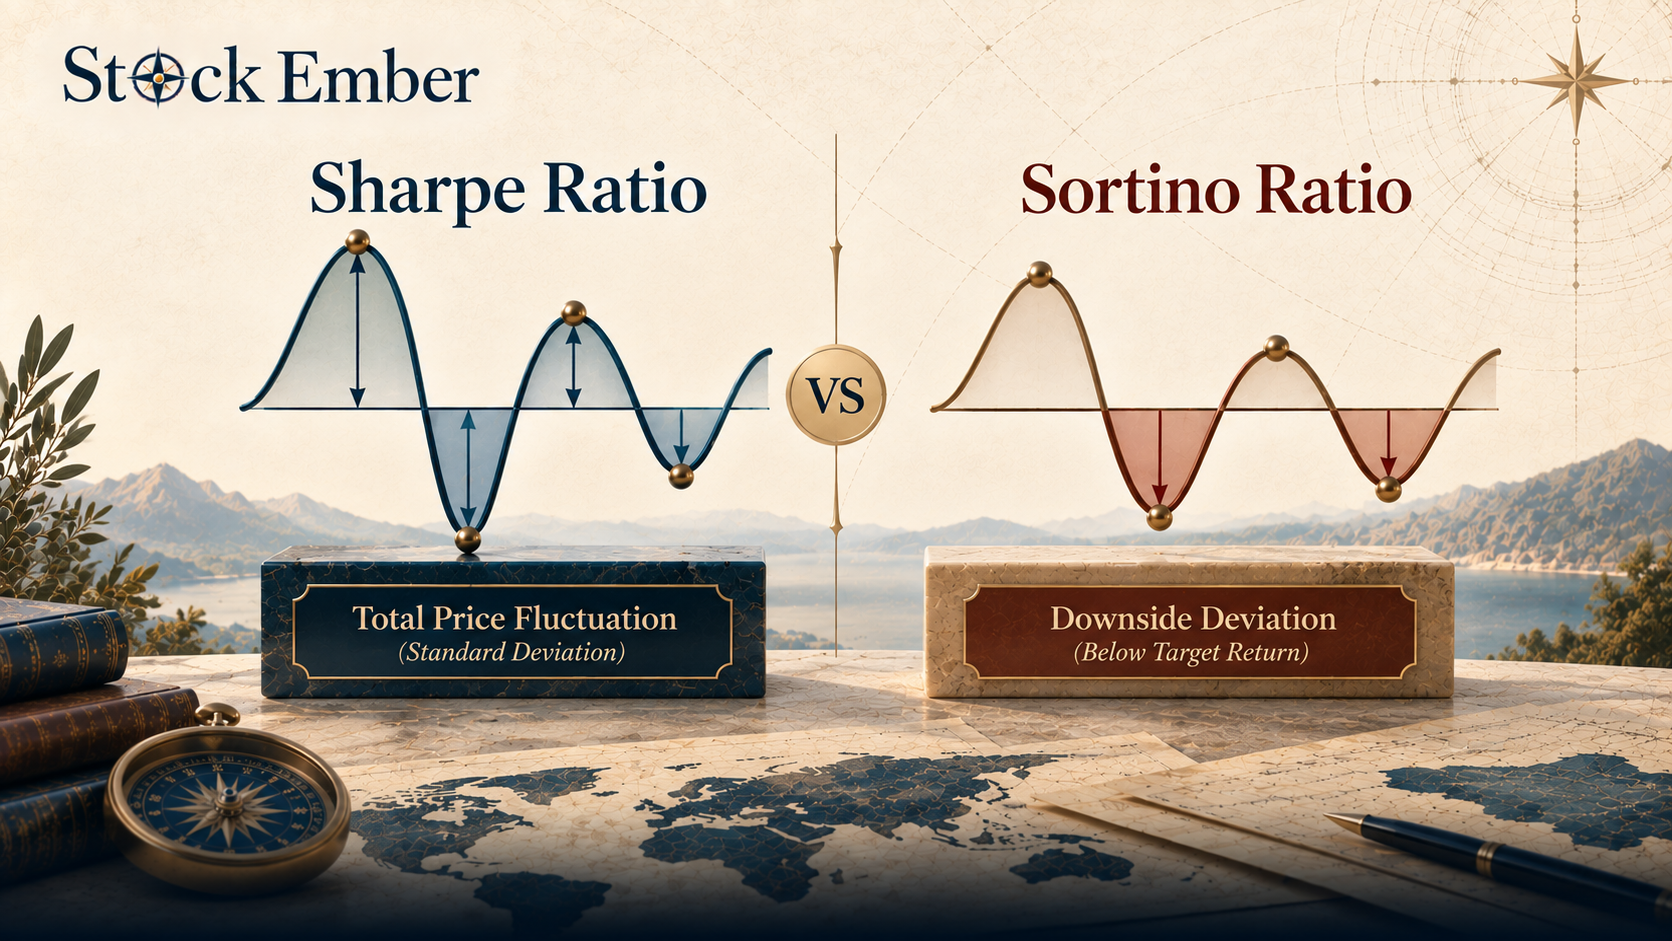
The primary difference between the Sortino ratio and the Sharpe ratio lies in how each metric defines portfolio volatility. The Sharpe ratio divides excess returns by total standard deviation, penalizing both upside gains and downside drops equally. In contrast, the Sortino ratio divides excess returns strictly by downside deviation, measuring only the negative price swings that cause actual financial loss.
The main difference in a Sortino ratio vs Sharpe ratio comparison lies in how each tool measures risk. The Sharpe ratio divides excess portfolio returns by total volatility, while the Sortino ratio divides excess returns strictly by downside risk.
Comparing two investments based solely on overall gains can hide severe price swings along the way. While total return shows where a portfolio ended up, risk-adjusted metrics show how smooth or stressful the path was. This guide breaks down how both ratios work, where they differ, and how long-term investors evaluate portfolio performance.
Quick Takeaways
01The Sharpe ratio penalizes all price swings equally, treating unexpected gains and unexpected drops as identical risks.
02The Sortino ratio focuses only on harmful losses by using downside deviation instead of total standard deviation.
03Using both metrics helps investors evaluate asymmetric strategies, dividend funds, and actively managed portfolios.
04High historical ratios do not guarantee future drawdown protection or shield a portfolio from broader market shocks.
What Are Risk-Adjusted Returns?
Raw returns tell only half the story of a portfolio's journey. If Portfolio A gains 10% in a year with small, steady price moves, and Portfolio B gains 10% through violent market swings, both show the same end return. Yet Portfolio B exposed the investor to far greater anxiety and drawdown risk.
Evaluating performance requires measuring return relative to the amount of uncertainty taken to achieve it. This measurement is called risk-adjusted return. By dividing excess gains over a safe benchmark by a measure of price volatility, risk-adjusted metrics level the playing field. They allow investors to compare funds with different risk profiles fairly.
For long-horizon buy-and-hold strategies, such as passive investing, tracking risk-adjusted returns helps confirm whether higher returns stem from genuine manager skill or simply taking on excessive market risk.
The Sharpe Ratio: Measuring Return Against Total Volatility
Developed by Nobel laureate William F. Sharpe, the Sharpe ratio is the standard benchmark for measuring risk-adjusted performance. It measures how much extra return an investor earns for taking on the additional fluctuation of a risky asset compared to a risk-free rate, such as short-term government bonds.
The calculation uses a simple plain-text formula:
Sharpe Ratio = (Portfolio Return − Risk-Free Rate) / Portfolio Standard Deviation
Here, standard deviation measures total volatility, how far monthly or annual returns drift from their historical average. A higher Sharpe ratio indicates better historical return per unit of total risk. A ratio above 1.0 is generally considered good, while ratios above 2.0 are exceptional.
However, the Sharpe ratio carries a clear limitation: it treats all price swings as bad. If a stock index suddenly surges upward by 20% in a month, standard deviation rises. The Sharpe ratio counts this positive jump as added risk, penalizing the portfolio score even though no investor complains about unexpected gains. This makes the metric less reliable when evaluating investments with lopsided or asymmetric return patterns.
The Sortino Ratio: Isolating Harmful Downside Volatility
To address the Sharpe ratio's flaw regarding positive price jumps, economist Frank Sortino introduced a modified approach. The Sortino ratio isolates harmful market falls while ignoring positive upward swings.
Instead of total standard deviation, it uses downside deviation, measuring returns that fall below a selected threshold known as the Minimum Acceptable Return (MAR).
By replacing total volatility with downside deviation, the metric focuses solely on negative returns that cause actual financial loss. The threshold is often set to zero or the risk-free rate.
For investors focused on capital preservation, the Sortino ratio offers a clearer view of drawdown risk. If two funds deliver identical annual returns, but one experiences frequent deep drops, its Sortino ratio will drop significantly lower than its Sharpe ratio. Official research standards from organizations like the CFA Institute highlight downside metrics when evaluating non-normal return distributions.
Comparison chart showing standard deviation versus downside deviation in portfolio analysis.
Sortino Ratio vs Sharpe Ratio: Core Differences
Understanding when to apply each tool depends on how returns are distributed across time. When evaluating a standard Sharpe ratio vs Sortino ratio matchup, the core differences come down to risk definition and target thresholds.
Feature
Sharpe Ratio
Sortino Ratio
Risk Metric Used
Total standard deviation (all volatility)
Downside deviation (negative drops only)
Treatment of Upside Jumps
Penalizes positive price spikes as volatility
Ignores upside price spikes completely
Risk Baseline
Risk-free rate (e.g., Treasury bills)
Minimum Acceptable Return (MAR or zero)
Best Suited For
Broad index funds with bell-curve returns
Skewed strategies, active funds, dividend ETFs
In practice, if an investment has symmetrical returns, where gains and losses occur with equal frequency and size, both ratios yield similar relative rankings. But when return patterns lean heavily in one direction, relying on the Sharpe ratio alone can misinform portfolio decisions.
Symmetric vs. Asymmetric Return Profiles
The choice in a Sortino ratio vs Sharpe ratio decision often rests on return symmetry. Standard broad-market stock indexes usually follow a relatively normal bell-curve distribution over multi-year periods. For broad equity index funds, the Sharpe ratio works well because major gains and major losses tend to balance out in standard deviation math.
However, asymmetric return profiles require the Sortino ratio. Examples include covered call funds, downside-buffered ETFs, options strategies, and actively managed income portfolios. These holdings deliberately trim downside drops or alter upside participation.
In practice, many long-term investors find that relying solely on the Sharpe ratio leads them to sell high-upside funds too early, misinterpreting healthy bull-market rallies as unwanted volatility.
When making adjustments between strategic vs tactical asset allocation reviewing both metrics ensures you do not mistake positive momentum for portfolio risk.
Common Pitfalls: What Historical Ratios Cannot Predict
While risk-adjusted metrics provide valuable historical insight, relying on them blindly introduces three practical mistakes:
Backtest Over-Fitting: Optimizing a portfolio to achieve the highest historical Sharpe or Sortino ratio often leads to poor future performance. Past price stability does not guarantee future market behavior.
Ignoring Tail Risk: Neither ratio fully accounts for rare, extreme events (black swan market crashes). A strategy can show high ratios for years before suffering a catastrophic fall.
Misjudging 10-Year Costs: Ratios calculate returns net of fees, but they do not highlight fee compounding. A fund charging a 1.00% annual management fee may show an attractive Sortino ratio during a bull market. Yet over a ten-year holding period, that fee takes roughly 10% out of total potential compounded wealth.
Always combine risk-adjusted ratios with analysis of fund holdings, liquidity, and underlying expense ratios.
Conclusion
Comparing the Sortino ratio vs Sharpe ratio reveals that no single number captures every dimension of portfolio risk. The Sharpe ratio remains an excellent starting point for broad index investments with balanced volatility. Meanwhile, the Sortino ratio provides a sharper lens for loss-averse investors evaluating asymmetric strategies by focusing strictly on harmful downside drops.
Using both metrics together gives a complete picture of historical performance without penalizing upside gains. As you refine your long-term portfolio, evaluating risk-adjusted returns ensures your asset allocation matches your personal risk tolerance.
When you are ready to evaluate individual funds and strategies, our ETF reviews are the place to start. Investing always puts capital at risk, and historical ratios never guarantee future protection against drawdowns, so treat these metrics as one tool within a complete research process.
FAQ
5 questions
Is the Sortino ratio better than the Sharpe ratio?
Neither ratio is universally superior; each serves a distinct purpose. The Sharpe ratio works well for broad index portfolios with balanced, symmetric price swings. However, the Sortino ratio is better suited for evaluating asymmetric strategies, such as dividend funds or active portfolios, because it isolates downside drops without penalizing positive upward moves.
Why does the Sharpe ratio penalize upside volatility?
The Sharpe ratio relies on standard deviation to measure risk. In mathematical terms, standard deviation measures how far portfolio returns drift from their average in both directions. As a result, sudden price spikes and unexpected market gains increase overall standard deviation, which lowers the portfolio's calculated Sharpe ratio score despite delivering positive performance.
What is considered a good Sortino ratio?
Generally, a Sortino ratio above 1.0 is considered acceptable, a ratio above 2.0 is strong, and a ratio above 3.0 is exceptional. A higher number indicates that the portfolio generates greater excess returns per unit of harmful downside risk. However, investors should compare ratios against similar fund benchmarks rather than judging numbers in isolation.
What is downside deviation in portfolio management?
Downside deviation is a volatility metric that measures price fluctuations falling below a specified target, known as the Minimum Acceptable Return (MAR). Unlike standard deviation, which measures all price movements, downside deviation ignores positive returns entirely. This gives risk-averse investors a focused measurement of potential capital loss and downside frequency.
When should you use the Sortino ratio over the Sharpe ratio?
You should use the Sortino ratio when evaluating investments with asymmetrical or skewed return patterns. This includes covered call strategies, downside-buffered funds, dividend-focused portfolios, and actively managed strategies. For these holdings, avoiding deep losses is critical, and the Sortino ratio prevents healthy bull-market rallies from distorting the risk score.
Disclaimer
This guide was written with AI assistance and reviewed by the StockEmber editorial team for accuracy. StockEmber provides independent education, not personal financial advice. Some links may support our work at no additional cost to you.
The StockEmber Team is our in-house desk of independent research writers. We test brokerage platforms, read the fine print on fees and custody, and cover ETFs and long-horizon investing for people who plan to hold for decades — not days.