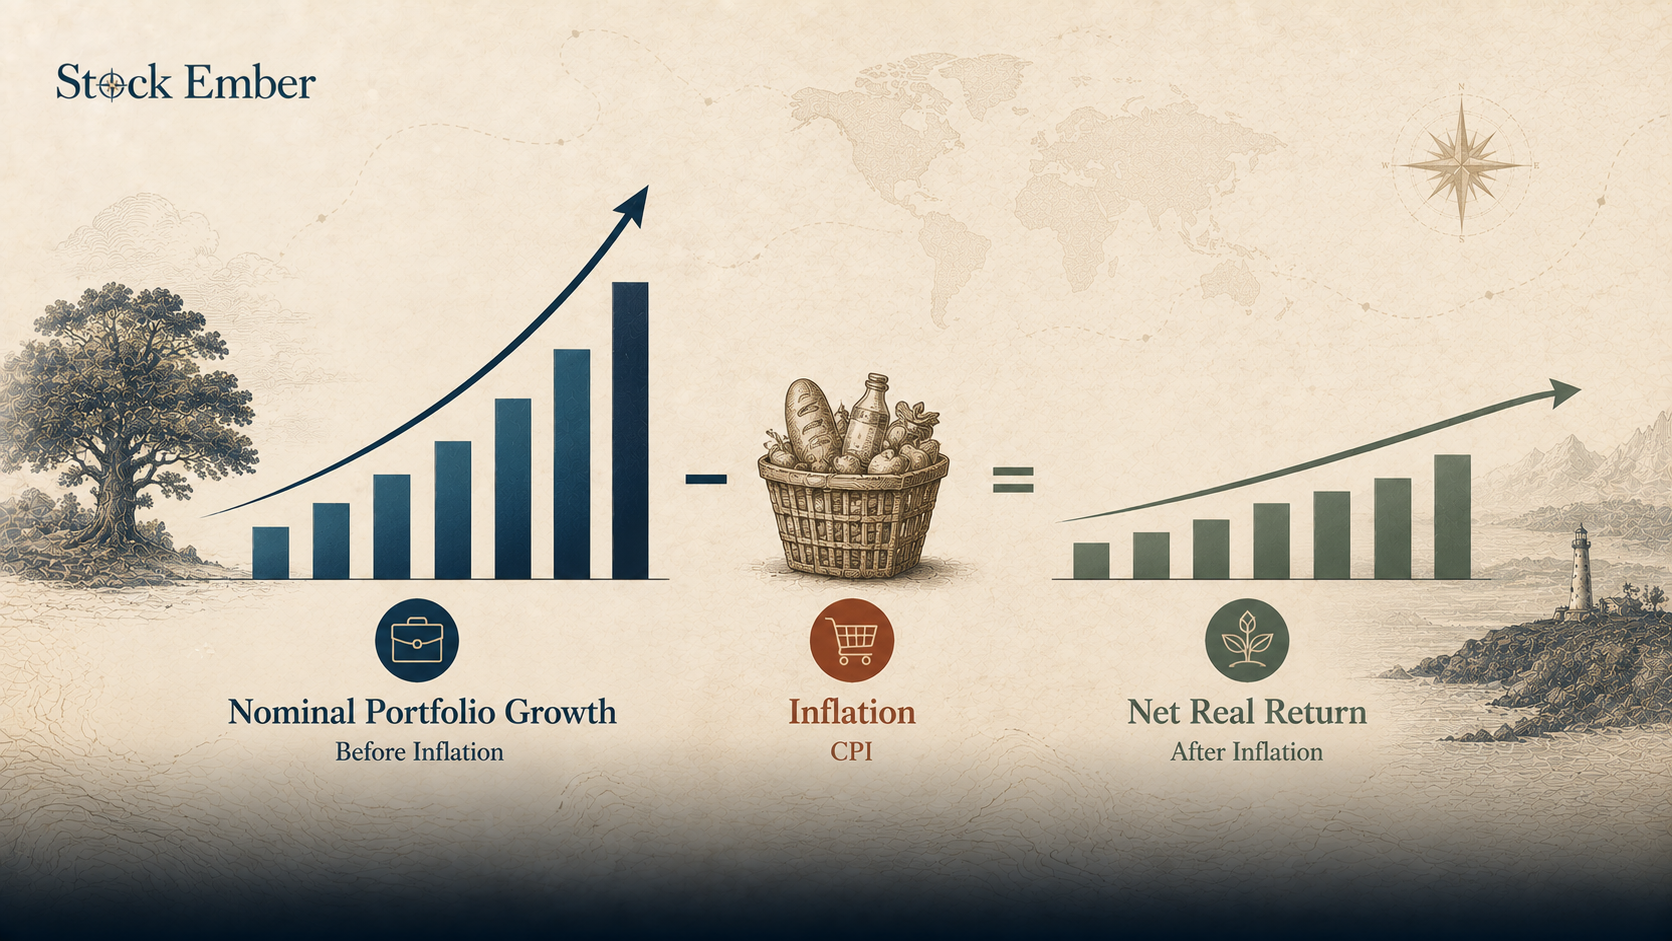
The real rate of return is the net percentage gain or loss on an investment after adjusting for the rate of inflation. It measures the actual change in purchasing power by subtracting price increases from nominal dollar returns.
The real rate of return is the annual percentage gain or loss earned on an investment after adjusting for the effects of inflation.
When evaluating portfolio growth, looking only at nominal dollar gains can obscure your actual financial progress. Inflation steadily increases the cost of living, reducing what each dollar can buy over time. This guide clearly defines the concept, explains how it differs from nominal returns, walks through the simple and exact formulas for calculating it, and shows how to preserve buying power over a 10-year horizon.
Quick Takeaways
01This metric measures the actual change in your purchasing power after subtracting price increases.
02Nominal returns measure dollar growth, whereas real returns show what those dollars can actually purchase.
03The exact real return is calculated using the Fisher equation, though a simple subtraction formula works for quick estimates.
04Uninvested cash and low-yielding bonds carry high inflation risk, frequently delivering negative real returns over long periods.
What Is Real Rate of Return?
To understand what is real rate of return, you must separate nominal monetary growth from real purchasing power.
In simple terms, this is the net percentage change in buying power delivered by an investment over a specific time frame. While your broker statement shows nominal returns, the total dollar increase in your account balance, the real return accounts for how price inflation alters the actual value of those dollars.
Tracking price levels relies on economic benchmarks like the Consumer Price Index (CPI) maintained by the US Bureau of Labor Statistics. If your portfolio balance grows by 6% in a year where consumer prices rise by 3%, your nominal return is 6%, but your real gain in purchasing power is approximately 3%.
Focusing strictly on nominal returns creates a psychological trap known as the "money illusion," where investors feel wealthier because their account balance rises, even if their actual purchasing power stays flat or declines.
How to Calculate Real Rate of Return: Simple vs. Exact Formula
When learning to calculate this figure, you can choose between a simple linear approximation and the exact mathematical formula.
1. The Simple Approximation Method
For quick mental calculations during low-inflation periods, you can estimate real return by subtracting the inflation rate directly from your nominal return:
Simple Real Return = Nominal Return − Inflation Rate
For example, if an index fund yields a nominal return of 8% and annual inflation is 2.5%:
Simple Real Return = 8.0% − 2.5% = 5.5%
2. The Exact Method (The Fisher Equation)
While subtraction works well for rough estimates, it becomes less accurate when inflation or nominal returns are high. Economists use the Fisher equation to calculate exact purchasing power growth:
The exact real return is 5.37%, slightly below the 5.5% linear estimate. Over multiple decades, this difference compounds into meaningful adjustments in financial plans.
Return Metric
High Inflation Scenario
Moderate Inflation Scenario
Low Inflation Scenario
Nominal Return
7.0%
7.0%
7.0%
Inflation Rate (CPI)
5.0%
3.0%
1.5%
Simple Real Return
2.0%
4.0%
5.5%
Exact Real Return (Fisher)
1.90%
3.88%
5.42%
Diagram comparing nominal return versus real inflation-adjusted return.
The 10-Year Portfolio Lens: Inflation, Fees, and Tax Drag
Evaluating wealth accumulation over a 10-year horizon reveals how inflation combines with fund management expenses and taxes to reduce net portfolio growth.
When reviewing nominal rates of return or calculating an annualized CAGR (Compound Annual Growth Rate) over ten years, failing to deduct ongoing friction leads to overestimating future wealth.
Consider a $100,000 portfolio held over a 10-year period:
Gross Nominal Return: 8.0% per year
Annual Fund Expenses & Platform Fees: 0.50%
Annual Tax Drag: 1.0%
Average Inflation Rate: 2.5%
Net Nominal Return = 8.0% − 0.50% − 1.0% = 6.5%
Using the Fisher equation to calculate the exact real return:
While the gross nominal return suggests your money doubles every nine years, the actual rate at which your purchasing power grows is 3.90% per year. After 10 years, your $100,000 balance grows nominally to roughly $187,700, but its actual buying power in today's dollars is closer to $146,600.
Keeping investment fees low and utilizing tax-efficient accounts helps preserve a higher real return over long holding horizons.
Common Pitfalls: The Money Illusion and Cash Drag
The most common mistake among long-term investors is treating nominal capital preservation as absolute safety.
Holding large sums of uninvested cash or low-yielding savings accounts avoids short-term market price swings, but it exposes capital to cash drag. If a savings account yields 1.5% while inflation runs at 3.0%, the nominal balance increases, but the exact real return is negative 1.46%. Over a decade, a continuous negative real return steadily destroys buying power.
Another pitfall is evaluating fixed-income investments on interest yield alone. A bond paying a 4% coupon sounds stable, but if inflation rises to 4%, the real yield drops to zero.
In practice, many long-term investors find that holding a diversified mix of productive assets such as global equities helps maintain positive real returns over multi-decade retirement horizons.
Conclusion
Focusing on real, inflation-adjusted returns ensures that your long-term financial planning reflects true purchasing power growth rather than illusory nominal gains. rather than illusory nominal gains. By accounting for inflation alongside fund fees and tax friction, you can select asset allocations that reliably outpace rising living costs over ten-year periods. When you are ready to evaluate broad-market index funds to build an inflation-resilient portfolio, our ETF reviews provide a clear breakdown of low-cost options. Investing involves market risk including potential capital loss, so treat this guide as educational material rather than individual financial advice.
FAQ
5 questions
What is the difference between nominal rate of return and real rate of return?
A nominal rate of return measures the total percentage increase in dollars without adjusting for inflation. A real rate of return adjusts nominal gains for price inflation, showing the actual change in your purchasing power over time.
How do you calculate the exact real rate of return using the Fisher equation?
The exact real rate of return is calculated using the formula: Real Return = ((1 + Nominal Return) / (1 + Inflation Rate)) − 1. This formula provides an exact measurement of purchasing power growth rather than a simple linear estimate.
Why can an investment have a positive nominal return but a negative real return?
If an investment's nominal yield is lower than the prevailing inflation rate, the purchasing power of your money declines. For instance, earning a 2% nominal return during a 4% inflation period results in a negative real return of approximately −2%.
Is the real rate of return adjusted for taxes as well as inflation?
Standard real rate of return calculations adjust specifically for inflation. However, long-term investors often calculate an after-tax real return by subtracting annual management fees and tax obligations alongside inflation to measure net wealth accumulation.
How does inflation affect long-term stock portfolio returns?
While inflation reduces the purchasing power of fixed cash distributions, broad-market equities historically generate real long-term growth because business revenues and asset values tend to increase alongside rising price levels over multi-year periods.
Disclaimer
This guide was written with AI assistance and reviewed by the StockEmber editorial team for accuracy. StockEmber provides independent education, not personal financial advice. Some links may support our work at no additional cost to you.
The StockEmber Team is our in-house desk of independent research writers. We test brokerage platforms, read the fine print on fees and custody, and cover ETFs and long-horizon investing for people who plan to hold for decades — not days.