

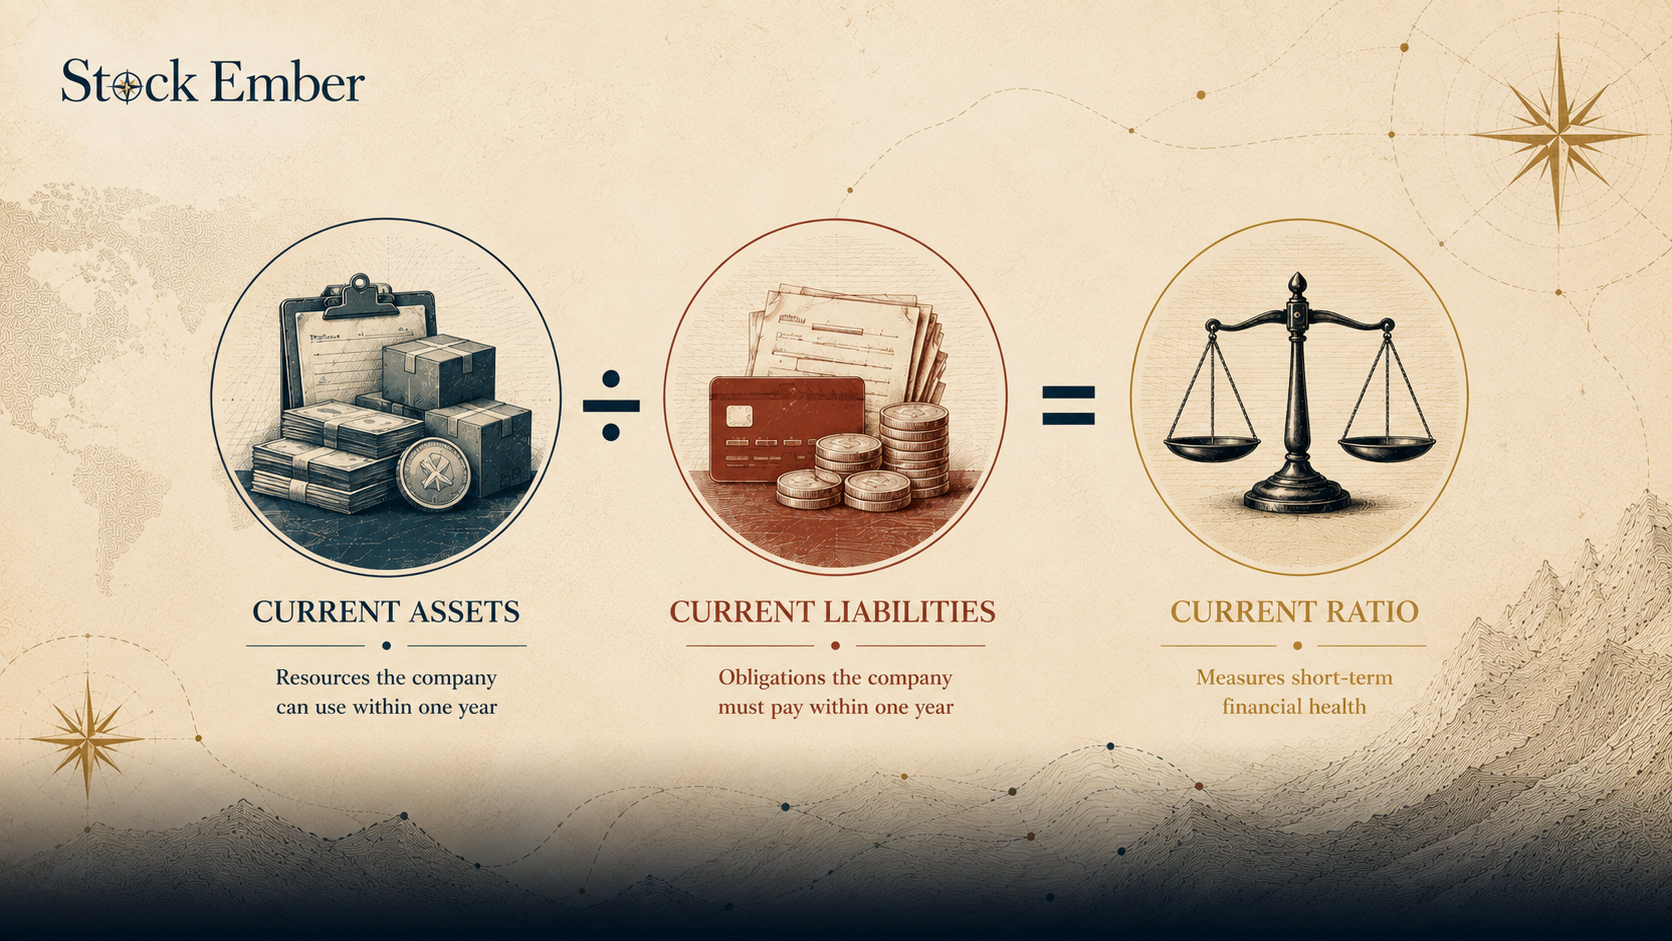
The current ratio is a financial liquidity metric that measures a company's ability to cover its short-term obligations using its short-term assets. It is calculated by dividing current assets by current liabilities.
When evaluating companies, investors often look beyond top-line revenue to ensure a business can pay its immediate bills without taking on expensive emergency debt. A company with weak short-term liquidity can quickly face financial distress even if it appears profitable on paper. This guide explains how it works, what constitutes a healthy benchmark, how it differs from the quick ratio, and what balance sheet red flags to watch.
Quick Takeaways
- The current ratio compares current assets to current liabilities to evaluate a company's short-term liquidity.
- A current ratio between 1.5 and 2.0 generally indicates a healthy liquidity cushion, though benchmarks vary significantly by industry.
- A ratio below 1.0 flags potential short-term solvency risk, while a ratio well above 2.5 may indicate inefficient capital allocation or bloated inventory.
- Unlike the quick ratio, it includes inventory and prepaid expenses, which may not convert into liquid cash immediately during a crisis.
What Is the Current Ratio? Definition & Formula
In current ratio accounting, the metric, also known as the working capital ratio, measures whether a company possesses sufficient short-term assets to satisfy its debts due within one year. It compares assets that can be converted into cash within twelve months against liabilities that must be paid within that same timeframe.
Understanding what is current ratio requires breaking down the balance sheet into two primary categories:
- Current Assets: Liquid assets including cash, cash equivalents, accounts receivable (uncollected payments owed by customers), inventory (goods held for sale), and prepaid expenses.
- Current Liabilities: Short-term financial commitments including accounts payable (unpaid bills owed to suppliers), short-term loans, accrued expenses (costs incurred but not yet paid, such as unpaid wages or taxes), and current portions of long-term debt.
The formula expresses this relationship as a simple division:
Current Ratio = Current Assets / Current Liabilities
For example, if a business holds $200,000 in current assets and $100,000 in current liabilities, its ratio is 2.0 ($200,000 / $100,000). This means the business holds $2.00 in short-term resources for every $1.00 of near-term obligations.
For anyone building foundational knowledge when investing in stocks, checking liquidity metrics ensures that a company can withstand economic downturns without diluting existing shareholders or taking on high-interest loans. What is a current ratio definition boils down to a core question: can the company pay its near-term bills on time?
What Is a Good Current Ratio? Industry Benchmarks
A good ratio typically falls between 1.5 and 2.0 for traditional commercial businesses, providing a comfortable cushion to meet short-term obligations. However, what is a good current ratio depends heavily on the company's business model, cash conversion cycle, and industry norms.
Investors generally interpret these benchmark ranges across four main levels:
- Below 1.0 (High Liquidity Risk): Current liabilities exceed current assets. The business relies on continuous daily cash flow, asset sales, or credit lines to satisfy near-term bills.
- 1.0 to 1.5 (Adequate but Narrow Cushion): The company can cover obligations, but unexpected operational delays or slow-paying customers could create cash strain.
- 1.5 to 2.0 (Healthy Benchmark Range): Indicates a strong liquidity buffer, showing that the company holds plenty of short-term safety reserves.
- Above 2.0 to 3.0 (Strong Safety Margin vs. Inefficiency): While very safe from debt default, ratios well above 2.5 can signal that management is holding idle cash or allowing unsellable inventory to accumulate rather than putting capital to work.
Industry context plays a massive role in ratio interpretation. Grocery chains and fast-moving retailers often operate comfortably with ratios close to 1.0 or even slightly below. They collect cash instantly from shoppers while enjoying extended 60-day or 90-day payment windows from suppliers. On the other hand, capital-intensive manufacturing firms require higher ratios, often 1.5 to 2.5 because raw materials and machinery take months to process into finished sales.
According to financial analysis guidelines published by the SEC, evaluating working capital components alongside industry averages provides a clearer picture of financial stability.
Current Ratio vs. Quick Ratio
The main difference between the current ratio and the quick ratio is that the quick ratio excludes inventory and prepaid expenses from current assets.
While it counts all short-term assets, the quick ratio (also known as the acid-test ratio) measures only "quick assets," resources that can be converted into cash almost immediately:
Quick Ratio = (Cash + Cash Equivalents + Marketable Securities + Accounts Receivable) / Current Liabilities
This distinction matters because unsold inventory cannot always be liquidated quickly during an emergency. If a company must sell inventory fast to pay off pressing debts, it may be forced to offer steep discounts. Comparing both ratios reveals how much of a company's short-term solvency depends on selling physical goods versus holding readily available cash.
Why Liquidity Matters for Buy-and-Hold Investors
For long-term buy-and-hold investors, monitoring liquidity ensures that a business can survive economic recessions without resorting to emergency debt raises or distressed asset sales.
Over a ten-year holding period, broader market shifts will test every company's balance sheet strength. A firm entering a downturn with a ratio below 1.0 may face severe solvency pressure if revenue suddenly drops by 20%. To keep operations running, management might be forced to issue new shares at low market prices, permanently diluting existing owners.
Maintaining healthy liquidity protects accumulated capital and allows companies to safeguard their retained earnings for future business expansion rather than burning cash reserves to settle routine supplier bills.
In practice, many long-term investors find that tracking multi-year trends in this metric reveals whether management maintains disciplined working capital control or relies on debt to mask operational inefficiencies.
Common Balance Sheet Red Flags to Watch
Evaluating balance sheet liquidity requires looking beyond the headline ratio figure to spot underlying quality issues within current assets:
- Bloated Inventory Distortion: A ratio above 2.0 driven entirely by rapidly rising inventory while sales growth slows down indicates obsolete stock that may require future value write-downs.
- Delayed Customer Collections: If current assets expand because accounts receivable are ballooning, the high ratio reflects uncollected customer debts rather than accessible cash.
- Seasonal Balance Sheet Swings: Evaluating a single quarterly snapshot can misrepresent seasonal businesses, such as retailers that intentionally build up inventory prior to peak holiday shopping periods.
What the Current Ratio Means for Investors
The ratio provides a clear snapshot of a company's short-term financial health by comparing liquid assets against upcoming liabilities. While a ratio between 1.5 and 2.0 reflects solid short-term stability for most businesses, comparing metrics against industry peers and checking inventory quality prevents misleading conclusions.
When you are ready to select a trading platform to build your long-term stock portfolio, our broker reviews offer an objective look at platform features and account choices. Always keep in mind that balance sheet analysis represents one part of fundamental research, and all stock investments involve the risk of market loss.