Anchoring bias is a psychological error where an investor relies too heavily on an initial price tag or past reference point, such as a purchase price cost basis or 52-week high, when evaluating an asset's current value. This cognitive shortcut causes investors to hold underperforming assets longer than fundamental business health justifies.
Anchoring bias is a psychological tendency where an investor relies too heavily on an initial price tag or past reference number when making financial decisions. This habit leads people to judge current asset value using historical benchmark numbers rather than actual economic facts.
If you have ever held onto a losing stock simply because you refused to sell until its price returned to what you paid, you have experienced this cognitive mental shortcut. Fixating on past purchase points can keep capital trapped in stagnant assets for years. This guide breaks down real-world anchoring scenarios, details the long-horizon portfolio damage, and provides clear steps to help buy-and-hold investors break free from arbitrary price traps.
Quick Takeaways
01Anchoring bias occurs when an initial price tag skews your judgment of an asset's true ongoing value.
02Historical entry prices and 52-week highs have zero influence on a company's future business cash flows.
03Refusing to sell an underperforming asset to break even creates a massive ten-year opportunity cost.
04Successful buy-and-hold investors evaluate assets using forward-looking business metrics rather than past price tags.
What Is Anchoring Bias?
Anchoring bias is a cognitive error where individuals anchor their numerical estimates to the first piece of information they receive. The concept was identified in 1974 by psychologists Amos Tversky and Daniel Kahneman, who demonstrated how arbitrary numbers alter human judgment even when those figures have no logical relation to the topic.
Within the broader field of behavioral finance, anchoring serves as a mental shortcut that leads investors to misjudge risk and value.
A classic anchoring bias psychology example involves asking participants to guess the percentage of African nations in the United Nations after spinning a roulette wheel numbered from 0 to 100. When the wheel landed on 10, the average guess was 25%. When it landed on 65, the average guess jumped to 45%. Even though a roulette wheel selection is completely random, the initial number anchored the participants' thoughts.
In financial markets, this same psychological mechanism causes investors to cling to arbitrary price tags like purchase costs, record highs, or initial valuation targets.
Everyday Anchoring Bias Examples in Real Life
Everyday commercial markets frequently use price anchors to guide consumer spending habits. Retailers regularly place a high original price tag next to a lower sale figure to make the current item feel like an immediate bargain.
A clear example of anchoring bias in daily commerce occurs on retail price tags that display "WAS $100, NOW $49." The original $100 figure serves as the mental anchor. Consumers evaluate the purchase as saving $51 rather than deciding whether the product is actually worth paying $49 for today. Similar dynamics happen in real estate, where an initial listing price anchors subsequent home offer negotiations, regardless of whether recent market changes support that valuation.
Anchoring Bias Examples in Stock Investing
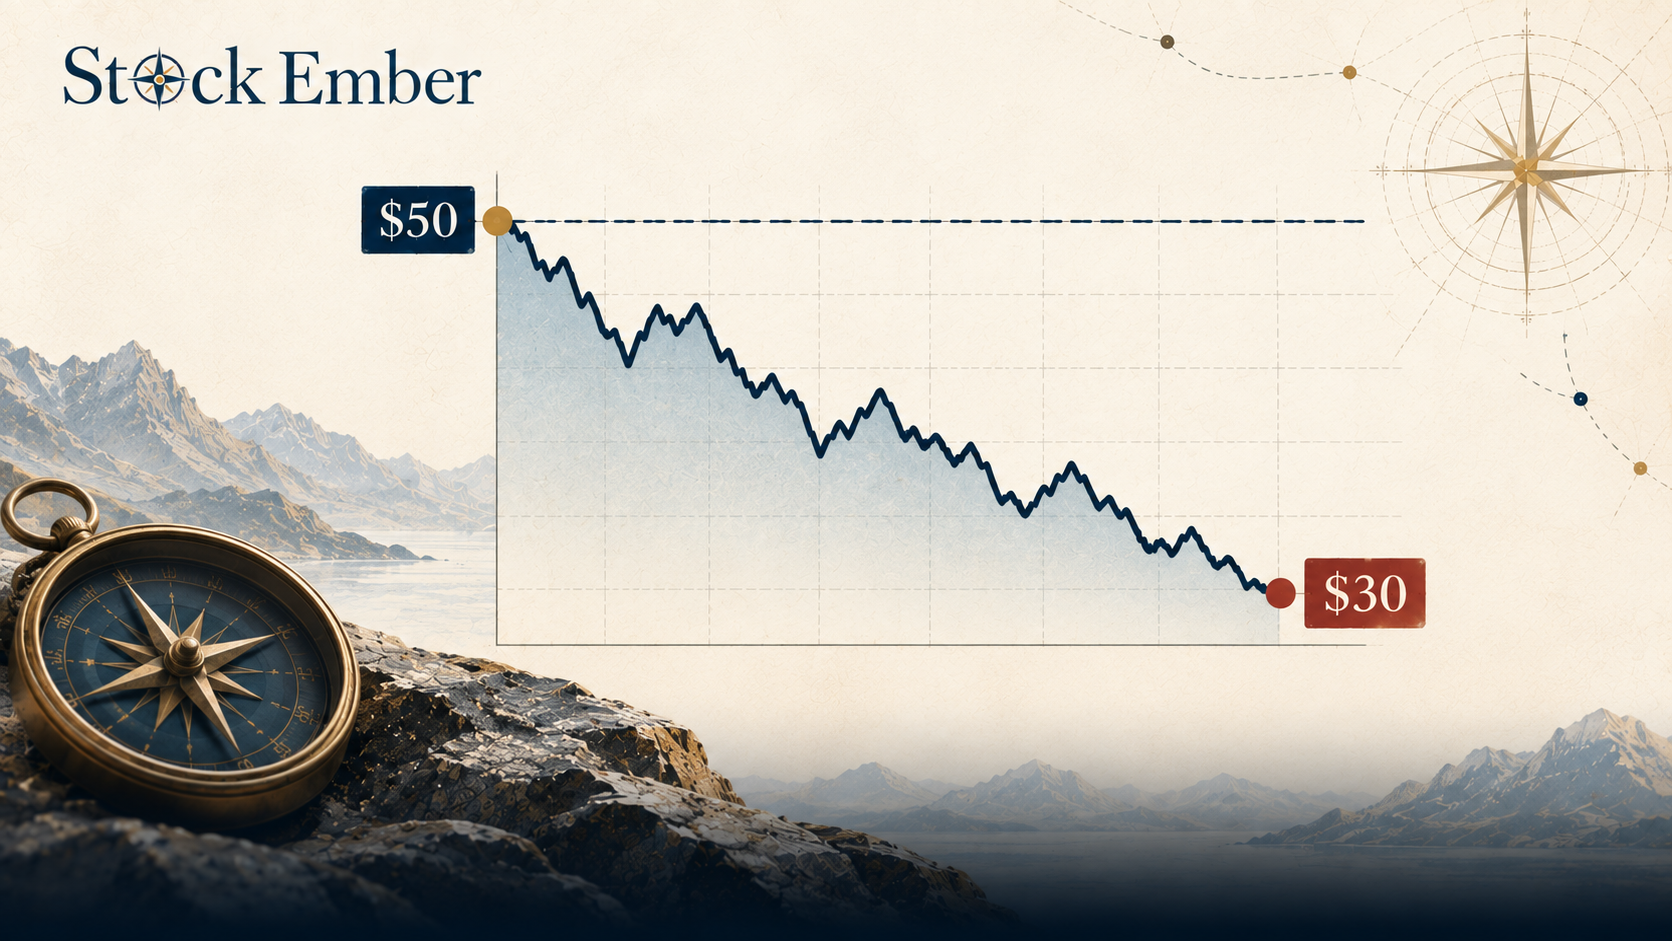
Stock market price anchors form when investors fixate on past market quotes rather than current financial realities. A common anchoring bias example in real life happens when an investor buys a stock at $50 per share and watches it fall to $30 due to deteriorating business sales.
Stock price chart illustrating purchase price anchor at 50 dollars while market value declines.
Rather than analyzing whether the business remains strong, the investor vows to sell only when the stock returns to $50. The $50 purchase cost basis becomes an arbitrary psychological anchor. The stock market does not know or care what price you paid for a share. Other common market anchors include:
52-Week Highs: Assuming a stock that fell from $200 down to $100 must be cheap because it used to trade higher.
Initial Public Offering (IPO) Prices: Believing a tech company must recover to its original listing valuation.
Cost Basis: Refusing to rebalance or cut losses because selling below the entry price turns a paper loss into a realized loss.
Fixating on these historical milestones prevents investors from conducting objective analysis. Guidance published by regulatory authorities like the US Securities and Exchange Commission highlights how mental biases often lead individual investors to hold declining positions longer than warranted by business fundamentals.
The 10-Year Portfolio Cost of Price Anchoring
Holding a stagnant asset to avoid realizing a loss creates a large hidden cost over a ten-year investment horizon. Capital trapped in an underperforming company cannot earn returns elsewhere in the economy.
Consider a simple ten-year comparison:
Suppose you hold $10,000 worth of Stock A, which has fallen to $30 per share from your $50 purchase price. To get back to even, Stock A needs to gain 66%. If the business fundamentals are permanently broken, Stock A may remain flat at $30 for the next ten years, ending with a value of $10,000.
If you instead accept the loss and reallocate that $10,000 into a broad market index fund averaging a hypothetical 7% annual compound growth rate, your portfolio outcome looks very different over ten years:
Future Portfolio Value = Principal * (1 + Annual Growth Rate) ^ Years
By anchoring to your original $50 purchase entry and waiting a decade to get back to even, you incur an opportunity cost of $9,671. The true cost of price anchoring is not just the temporary loss on paper, but the missing compounded growth your capital could have built in a healthier productive asset.
Anchoring Bias vs. Herd Mentality
Anchoring bias occurs when an individual fixates on a specific reference number, whereas herd mentality happens when an investor copies the actions of the broader crowd without independent research.
While these two psychological traps originate from different triggers, they frequently reinforce each other during volatile market cycles:
Bias Feature
Anchoring Bias
Herd Mentality
Primary Trigger
A specific historical number or price point
Popular opinion and social crowd activity
Investor Mindset
"I will hold, until it reaches $50 again."
"Everyone else is buying, so I must join in."
Portfolio Risk
Holding dead assets for years to break even
Buying overvalued assets at speculative peaks
During market panics, herd mentality drives panic selling across the market. Investors trapped by anchoring bias often refuse to adjust their portfolio expectations, holding onto falling single stocks because they are anchored to peak prices.
In practice, many long-term index investors find that removing individual purchase prices from their primary portfolio view helps reduce emotional stress. Viewing total portfolio value rather than itemized profit-and-loss per stock prevents arbitrary entry prices from dictating monthly rebalancing steps.
How Long-Term Investors Can Avoid Anchoring Bias
Long-term investors can reduce anchoring errors by building rule-based evaluation habits that disconnect portfolio decisions from past price tags.
To maintain a disciplined long-horizon approach, consider these core habits:
Focus on Forward-Looking Fundamentals: Base holding decisions on future corporate earnings, revenue stability, and balance sheet strength rather than past stock price charts.
Use Automated Indexing: Holding broad market index funds eliminates the temptation to track individual purchase price anchors for dozens of single stocks.
Schedule Calendar-Based Rebalancing: Review your asset portfolio on set dates (such as once per year) using target percentage allocations rather than selling based on price swings.
Frame Decisions in Cash Terms: Ask yourself: "If I held this current portfolio value in cash today, would I buy this exact asset again?" If the answer is no, holding it simply to break even is a sign of price anchoring.
Conclusion
Price tags are historical facts, not indicators of future market returns. Clinging to past purchase entry points or record peak prices distracts from objective financial evaluation and quietly destroys long-term portfolio growth through lost compounding opportunities. Successful long-horizon investing requires making decisions based on forward-looking intrinsic value and disciplined asset allocation.
When you are ready to build a rule-based core allocation that avoids single-stock price traps, exploring detailed ETF reviews offers a practical path toward broad market diversification. Because all market investments carry risk of capital loss and past performance never guarantees future results, use these insights to strengthen your personal research framework.
FAQ
5 questions
What is an example of anchoring bias in real life?
A classic real-life example occurs in retail sales, where stores display an item with a crossed-out original price tag of $100 next to a sale price of $49. The initial $100 figure serves as a psychological anchor, making consumers feel they are saving $51 rather than evaluating whether the item is truly worth $49 today.
How does anchoring bias affect stock market investors?
Stock investors frequently anchor to their purchase cost basis or historical 52-week highs. For instance, an investor who bought a stock at $50 per share may refuse to sell it when it drops to $30 due to poor business performance, waiting until it gets back to even. This anchor causes capital to remain trapped in non-performing assets.
What is the main cause of anchoring bias in investing?
Anchoring bias is caused by the human mind's reliance on mental shortcuts when processing complex numerical information. Identified by Amos Tversky and Daniel Kahneman, the bias occurs because people automatically use initial reference points as baseline benchmarks, even when those historical figures have no bearing on future outcomes or intrinsic financial value.
How does anchoring bias differ from herd mentality?
Anchoring bias occurs when an individual investor fixates on a specific reference price point, such as a purchase price or peak valuation. In contrast, herd mentality occurs when an investor follows the collective actions of the crowd without performing independent research. While anchoring fixes on numbers, herd mentality mimics crowd behavior.
How can long-term investors avoid price anchoring traps?
Buy-and-hold investors can avoid anchoring bias by focusing on forward-looking business fundamentals rather than historical price charts. Strategies include automating index fund contributions, setting calendar-based portfolio rebalancing schedules, and framing decisions around total cash allocation rather than individual stock profit-and-loss line items.
Disclaimer
This guide was written with AI assistance and reviewed by the StockEmber editorial team for accuracy. StockEmber provides independent education, not personal financial advice. Some links may support our work at no additional cost to you.
The StockEmber Team is our in-house desk of independent research writers. We test brokerage platforms, read the fine print on fees and custody, and cover ETFs and long-horizon investing for people who plan to hold for decades — not days.