

The cost of investing is the sum of all fees, commissions, and execution frictions paid to build and maintain a portfolio. Over time, these charges directly reduce your net returns.
Even minor annual charges compound silently against your wealth, eroding tens of thousands of dollars over a multi-year horizon. Understanding how fund management fees, platform maintenance charges, and market execution drag interact allows you to audit your holdings and protect your long-term growth. This guide outlines every major cost layer and provides a clear framework to minimize fee drag over a 10-year holding period.
Quick Takeaways
- Investment costs extend beyond visible trading commissions to include fund management expenses, platform custody charges, and market execution drag.
- A seemingly small annual fee of 0.75% can erode roughly 7% to 8% of your total portfolio wealth over a 10-year holding period.
- Zero-commission trading platforms often monetize through secondary friction, such as widened currency conversion markups and order routing practices.
- Auditing fund-level costs, platform schedules, and foreign exchange markups allows long-term investors to minimize drag without changing asset allocation.
Understanding the three Layers of Investment Costs
Investment costs divide into three distinct layers: fund-level management fees, platform administrative charges, and market execution friction. Focusing exclusively on one element—such as zero trading commissions—leaves investors vulnerable to significant cost leakage in the remaining categories.
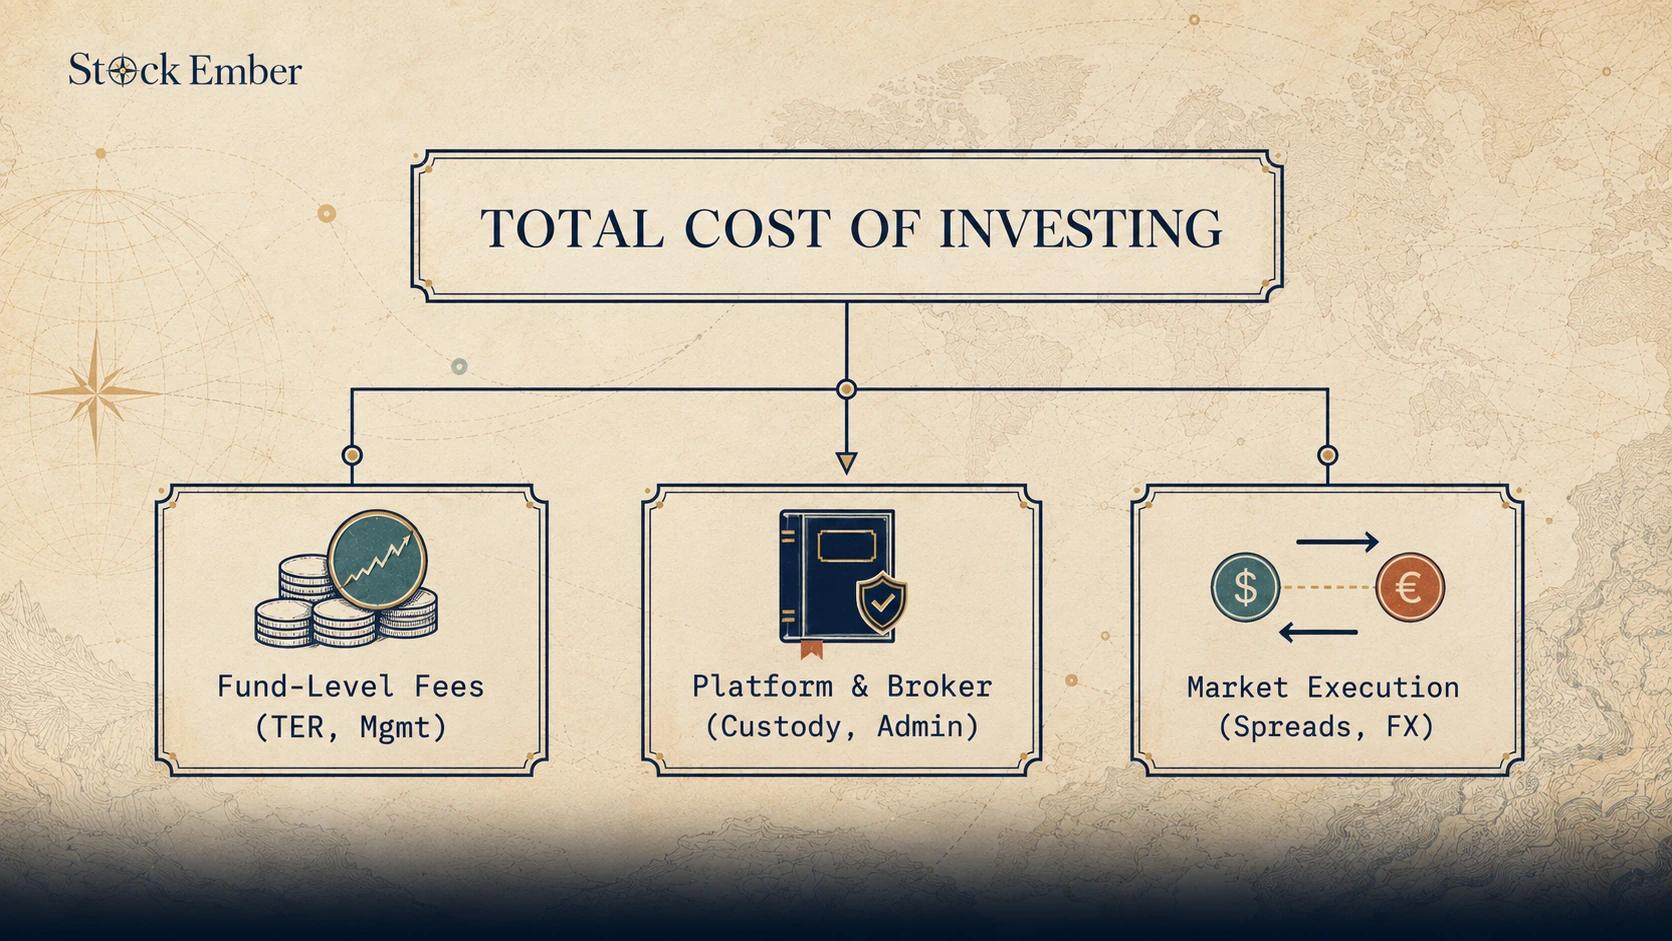
Long-term index and ETF investors require a full-spectrum view of these expenses. A single trade might incur zero upfront broker commission, but holding the resulting asset for a decade exposes your principal to daily management deductions, potential platform holding charges, and currency markups.
By evaluating all three layers simultaneously, you establish the true total cost of ownership (TCO) for every asset in your portfolio.
1. Fund-Level Fees: Expense Ratios and Management Charges
Fund-level fees represent the ongoing operational, administrative, and portfolio management expenses deducted directly from an investment fund's assets. Rather than sending you an explicit bill, collective vehicles like Exchange-Traded Funds (ETFs) and mutual funds subtract these fees daily from the net asset value (NAV), silently lowering your daily investment returns.
To evaluate fund-level friction accurately, you must look at specific metrics:
- Annual Operational Costs: Understanding what an expense ratio is provides the foundation for analyzing fund management fees. It reflects the baseline percentage subtracted annually to cover fund operations.
- Comprehensive Internal Drag: A fund's base management fee does not tell the full story. Examining Total Expense Ratio (TER) reveals additional embedded charges, such as legal fees, accounting expenses, and operational audit costs that standard fee quotes ignore.
- Cost Efficiency Standards: Evaluating whether a fund is price-competitive requires knowing what qualifies as a good expense ratio across passive index funds and active strategies.
- Legacy Vehicle Mechanics: Broadening your perspective to traditional pooled funds means reviewing mutual fund fee structures, including front-end loads, back-end redemption fees, and ongoing distribution costs.
For passive long-term investors, keeping fund-level fees as low as possible is critical. Passive broad-market index ETFs typically operate at a fraction of the cost of actively managed funds, ensuring that a larger share of market growth remains in your portfolio.
2. Platform & Broker Fees: Custody and Account Maintenance
Platform and broker fees are administrative charges levied by financial institutions for hosting your account, maintaining records, and providing market access. While trading commissions have trended toward zero across much of the retail industry, platforms continue to generate operational revenue through ongoing service charges.
Platform costs generally fall into two main categories:
| Fee Category | Description | Primary Impact |
|---|---|---|
| Custody & Account Fees | Ongoing recurring percentage or fixed charges for holding assets on the platform. | Direct, ongoing deduction from cash or portfolio value. |
| Administrative Charges | Event-based fees for transfers, paper statements, wire transfers, or account inactivity. | Intermittent friction during specific account actions. |
A core cost to assess when selecting a broker is the brokerage platform fee, which can take the form of a flat monthly subscription or an annual percentage charge calculated on your overall account balance.
For small portfolios, fixed monthly platform fees create a disproportionately heavy drag. Conversely, percentage-based custody fees become increasingly expensive as your portfolio compounds over a multi-decade horizon.
3. Market Execution Friction: The Hidden Costs of Trading
Market execution friction encompasses the indirect trading costs incurred during asset transactions, including price spreads, foreign exchange markups, and order routing dynamics. These costs are rarely listed on standard broker fee schedules, making them invisible to casual retail investors.
Three primary mechanics generate execution friction during market transactions:
- Liquidity Spreads: Every market asset maintains a buyer price and a seller price. Evaluating the bid-ask spread reveals the immediate transaction penalty paid upon entering or exiting a position.
- Foreign Exchange Markups: Purchasing international assets denominated in foreign currencies incurs a currency conversion fee, which often ranges from 0.20% to over 1.50% above spot exchange rates.
- Order Routing Dynamics: Brokerages offering commission-free trading may monetize execution flow through payment for order flow (PFOF), which can lead to inferior order execution pricing for retail trades.
How Investment Costs Connect: The 10-Year Compounding Lens
Investment costs compound against your portfolio over time in the exact same mathematical fashion that market returns compound in your favor. A fee paid today is not merely a single dollar lost; it is a dollar stripped of its capacity to generate compounding returns for decades to come.
Consider a hypothetical $100,000 investment held over a 10-year period with an assumed average gross annual market return of 7% :
- Scenario A (Low Drag): Total combined annual drag (fund TER + platform custody) of 0.10% per year.
- Scenario B (Moderate Drag): Total combined annual drag of 0.85% per year.
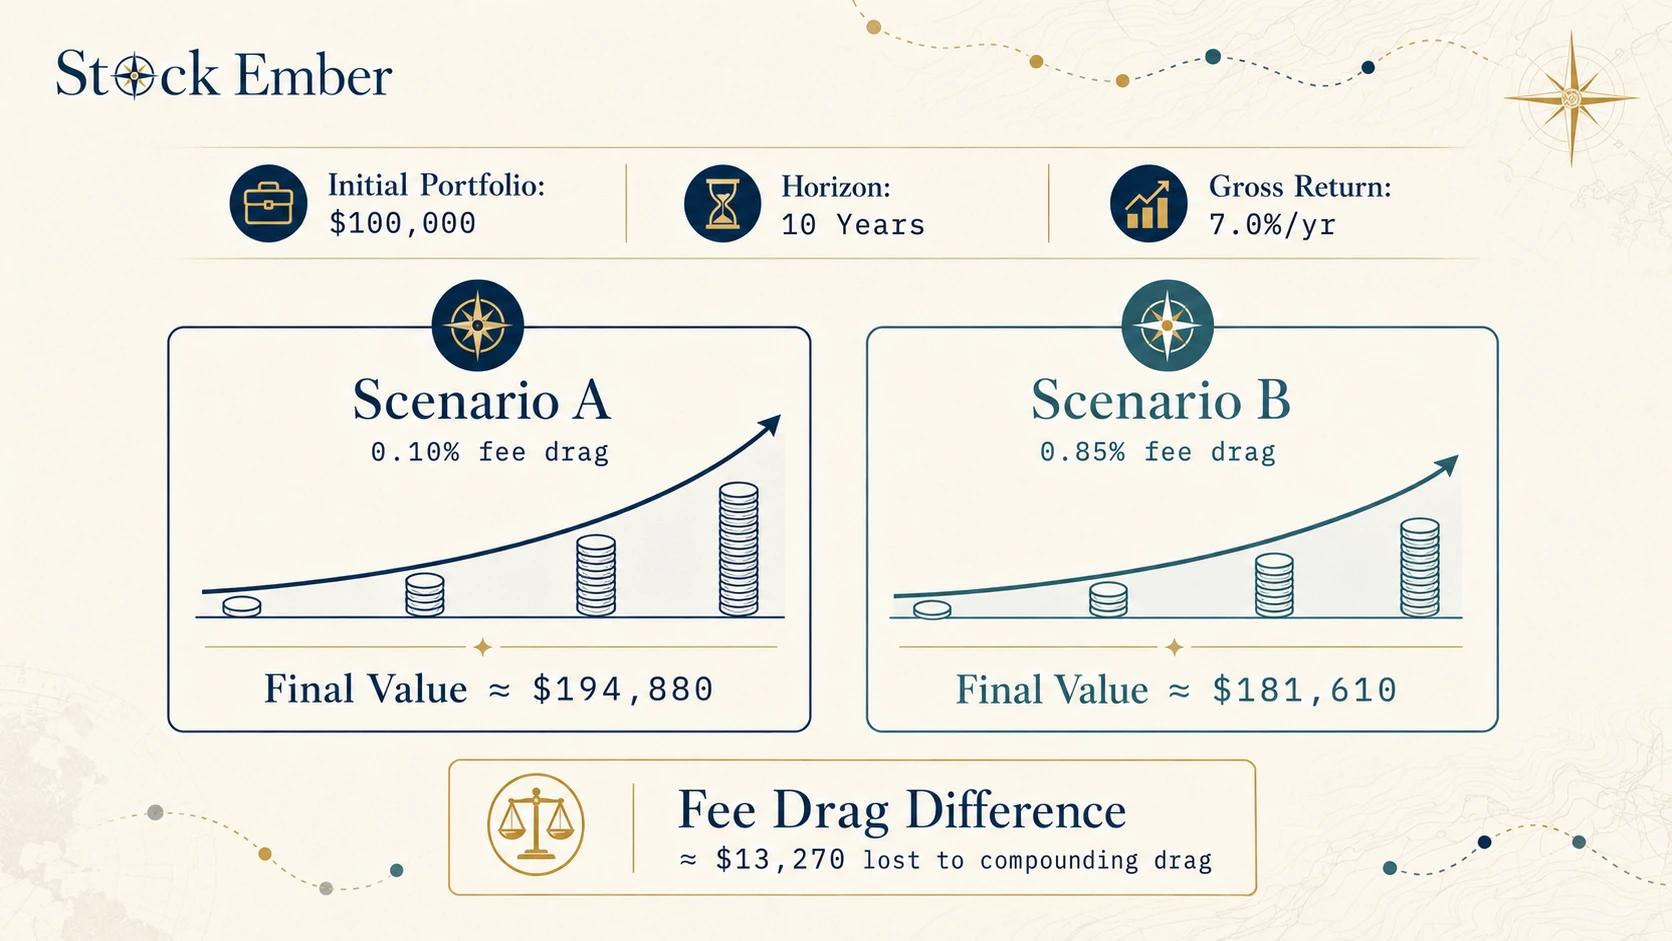
In Scenario B, the apparently modest 0.75% difference in annual costs forfeits roughly $13,270 in terminal wealth over ten years. The higher fee layer erodes roughly 7% to 8% of the total potential portfolio growth over the decade.
When you combine a 0.50% fund expense ratio with a 0.25% annual platform custody fee and an initial 1.00% foreign exchange conversion markup, the cumulative drag severely hampers long-term portfolio growth.
Where to Start: Auditing Your Portfolio's Total Cost
Auditing your portfolio's total cost requires systematic review of fund documents, brokerage fee schedules, and currency conversion terms across every asset you hold.
Follow this three-step framework to identify and eliminate unnecessary fee leaks:
- Audit Fund-Level Expense Ratios: Review the key investor information documents for all held funds. Identify vehicles charging higher management fees where lower-cost, passive index equivalents exist.
- Review Platform and Currency Schedules: Inspect your brokerage's official fee schedule for hidden monthly custody charges, account maintenance fees, or unannounced FX markups.
- Optimize Execution Practices: Use limit orders on highly liquid market assets to narrow spread friction, and minimize unnecessary currency conversions by trading in your account's primary currency where practical.
Conclusion
Minimizing investment costs is one of the most reliable levers long-term investors can apply to improve net lifetime returns. While market movements remain inherently unpredictable, every fraction of a percent saved in administrative fees, management costs, and execution friction stays directly in your portfolio to compound over time.
By evaluating costs through a comprehensive 10-year total cost of ownership framework, you ensure that fee leakage does not quietly compromise your financial independence. When you are ready to evaluate the exact impact of these fee layers on your personal holdings, exploring interactive investment calculators provides the ideal next step.